Data visualization is a form of visual communication that represents data in forms that is easy to understand (often charts or tables) and allow for analysis and reasoning about said data; visual representations of data.
A generally known goal of data visualization is to communicate information clearly and efficiently using plots, statistical graphics, and information graphics. Quantitative data may be encoded using dots, bars, or lines, to visually communicate a numerical message.
Effective visualization makes complex data more accessible, understandable and usable. Analysts may have particular analytical tasks, such as making comparisons or understanding causality, and the design principle of the graphic (i.e showing comparisons or showing causality) follows the task.
Tables are generally used where users will look up a specific measurement, whereas charts of various types are used to show patterns or relationships in the data for one or more variables.
Data visualization is both an art and a science. Increasing amounts of data created by Internet activity and an expanding number of sensors in the environment are referred to as “big data” or Internet of things. Processing, analyzing and communicating this data present multiple ethical and analytical challenges for data visualization.
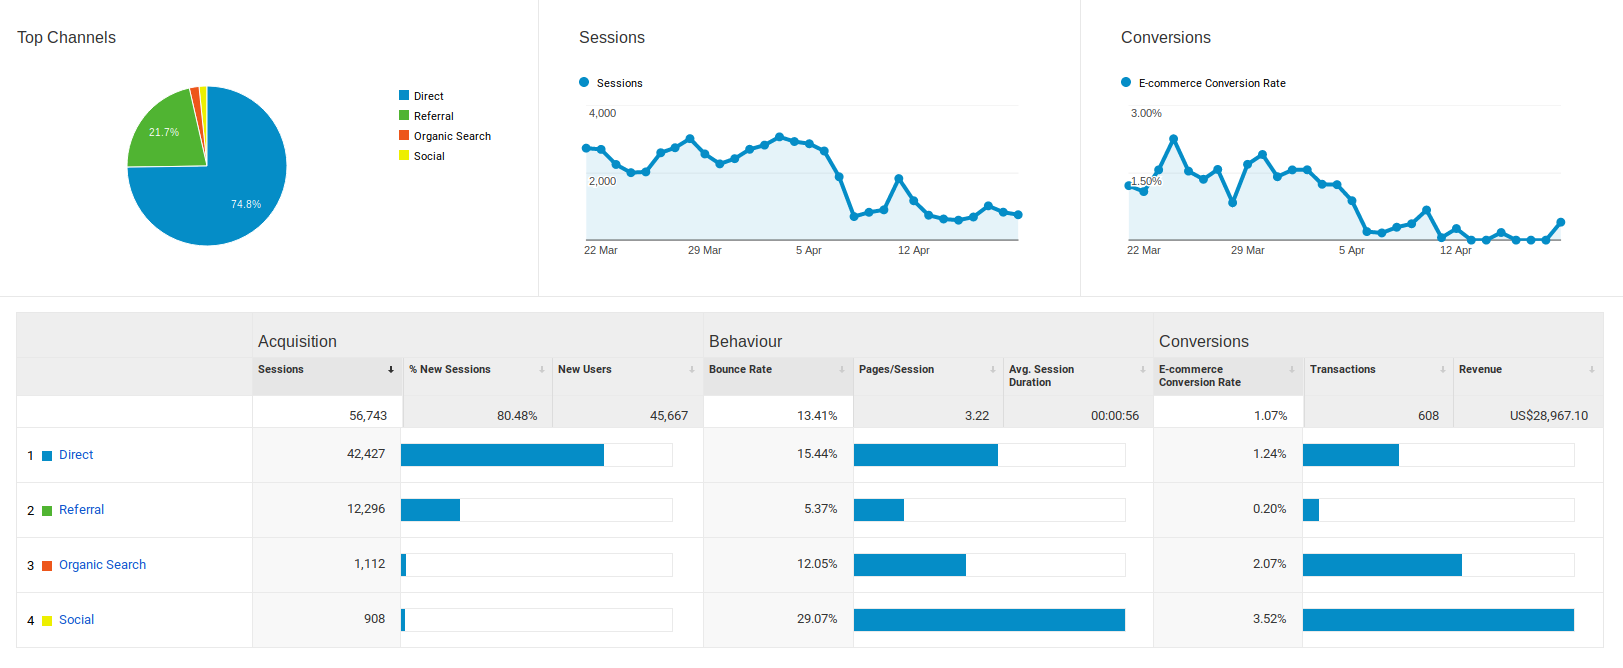
In web analytics, the most popular tool to collect and visualize data is Google Analytics, also shown in the screenshot above.
Last modified: April 20, 2017
Want to see more articels like What is Data visualization? Check out all definitions in the Analytics Dictionary.