Heatmaps are known as one of the easiest ways to get insights on how people are actually interacting with your website. And knowing how your website is being used is a crucial part of any improvement you are going to make.
Click Heatmaps
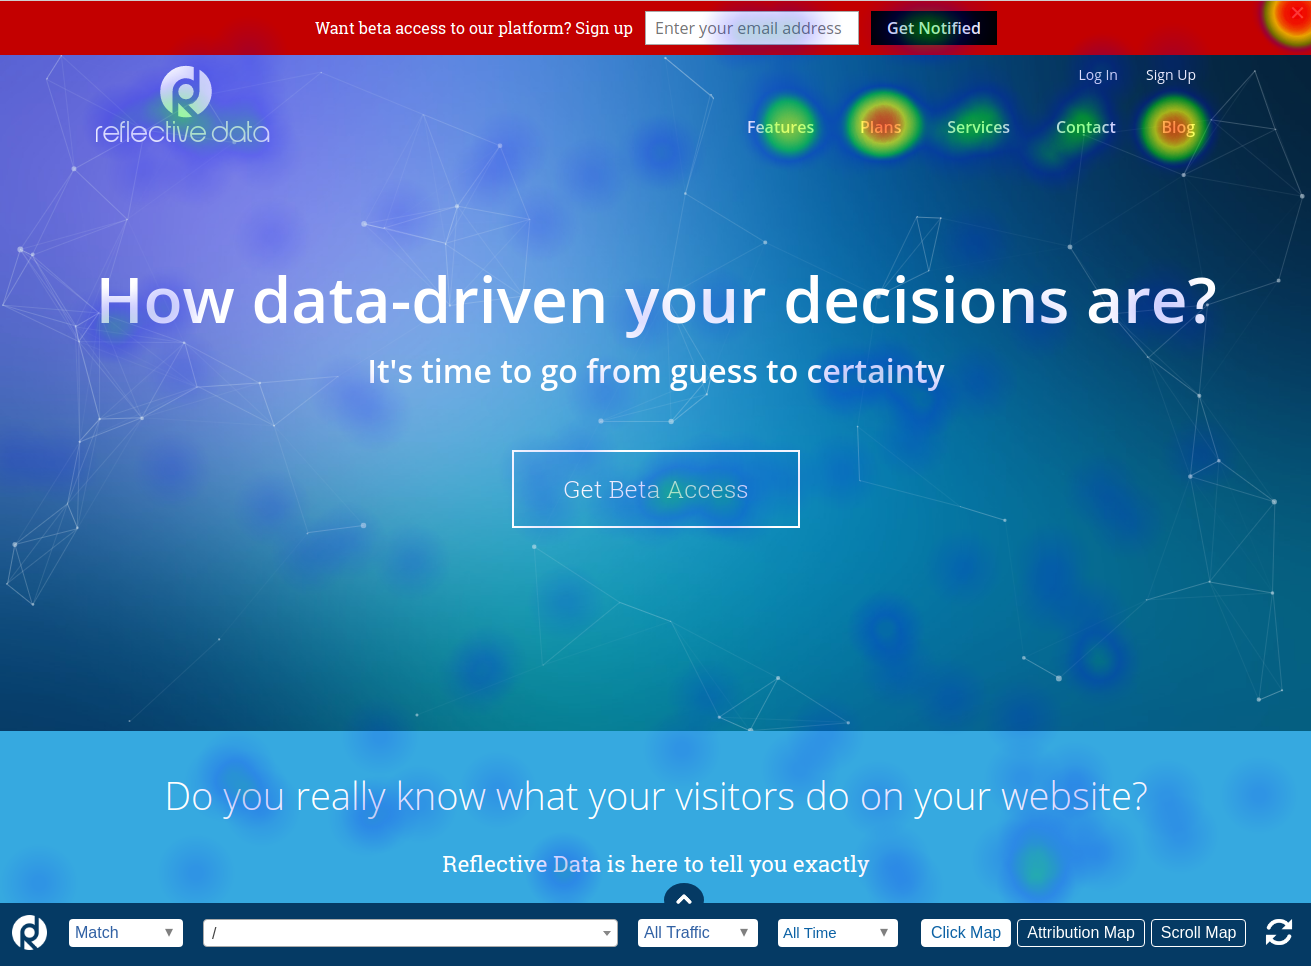
Click Heatmaps are showing every single click that visitors make on your website.
This gives you a very good overview of which content is most attractive for your visitors. Use advanced segmentation to see if it differs for people from different backgrounds.
Some of the key insights to look for:
- Which menu items are the most popular, which are ignored?
- Are people clicking on elements that are not clickable (some images etc.)?
- Is there something driving attention away from the main call to action?
Attribution Heatmaps
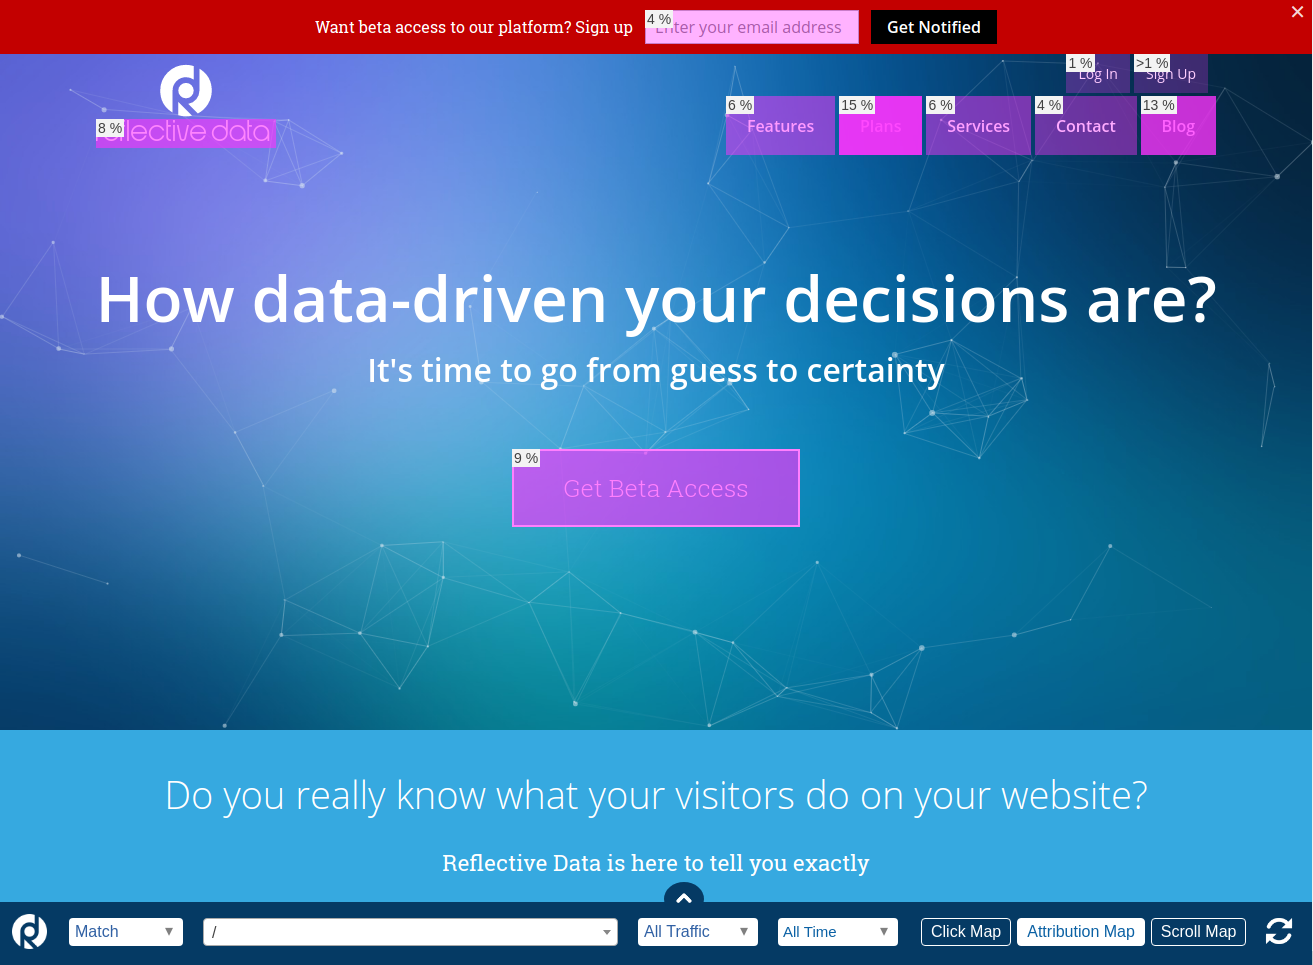
Once you have covered the general Click Heatmaps, it's time to move on to more advanced reports.
Attribution Heatmaps tracks only the clicks on elements that are meant for clicking, links, buttons etc.
Besides color representation, it will also show the percentage of all tracked clicks that took place on a specific element.
While it answers pretty much the same questions as Click Heatmaps, it will help you put real numbers in your analysis.
Scroll Heatmaps
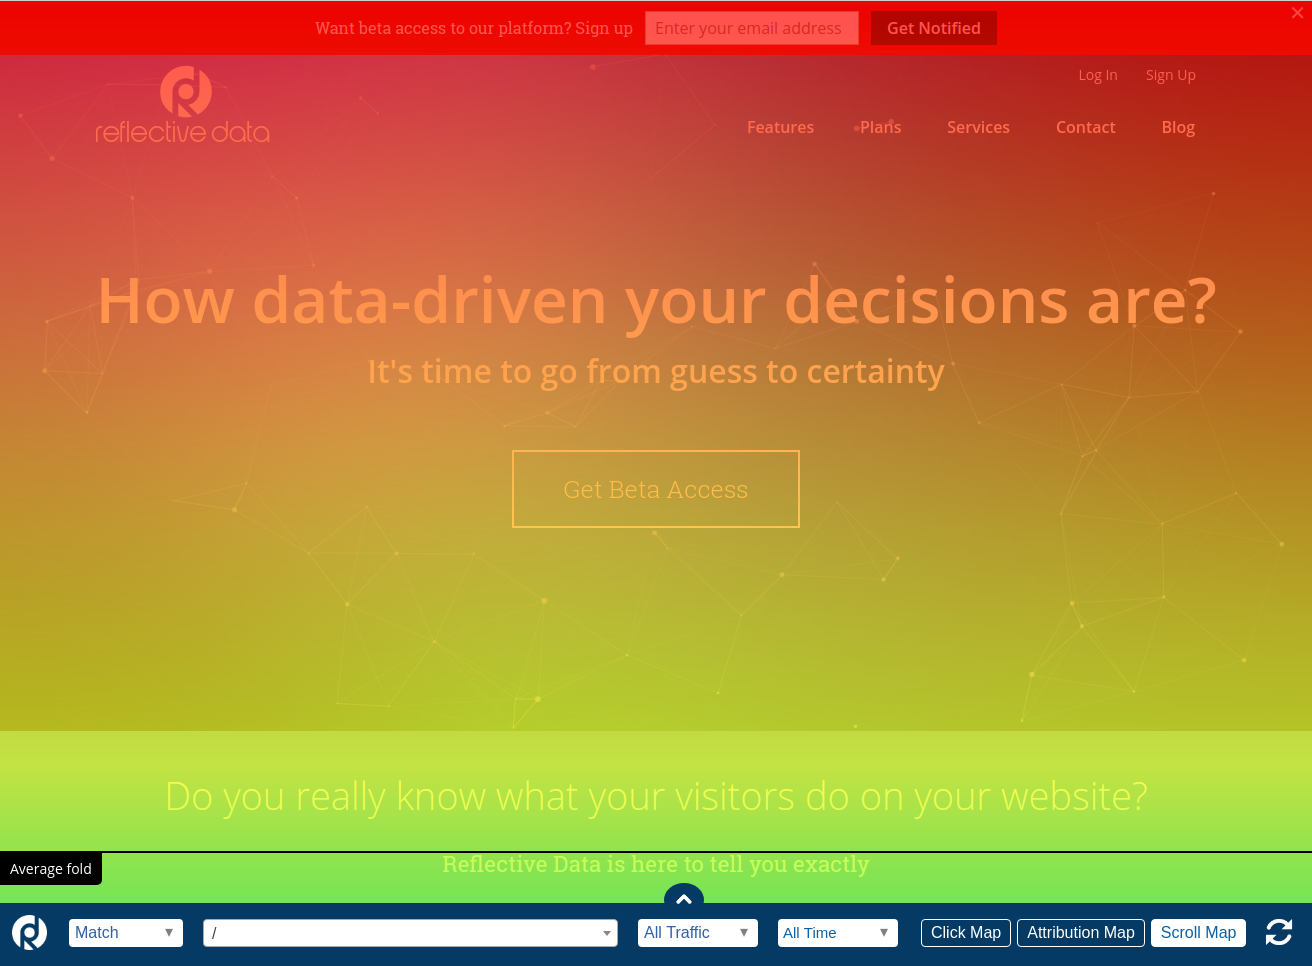
Scroll Heatmaps work together with click Heatmaps to give you even more detailed overview of which parts of your website are being seen the most, and which parts not so much.
Combine this data with other metrics on Reflective Data to figure out which information should be relocated, changed or maybe even removed.
Scroll Maps have proven to be useful on every type of pages that are longer than the "fold". No matter whether it's a blog post, sales page or a product page - Scroll Maps shows exactly how often certain elements are being seen.