Google Analytics’s visual interface is great for getting a quick overview and basic data exploration. Often times, in order to find useful insights, you need to take a deeper look and the visual interface just don’t cut it anymore.
In case you are like me, and many other data-driven marketers/analysts, you like working with spreadsheets. Luckily, pulling your Google Analytics data into Google Spreadsheets is easier than you might think.
In this article, we are covering both the easiest solution for pulling some data using a plugin as well as writing your own Apps Script for more advanced solutions and even automation of periodic pulls.
Getting Started with Pulling Google Analytics Data into Google Sheets
In case you have no or very little experience with automatically pulling data from Google Analytics, I would recommend getting started with a Google Analytics Add-on for Google Sheets.
Once you have the add-on installed, using it is rather straightforward. Here are the steps you need to take before seeing your first report.
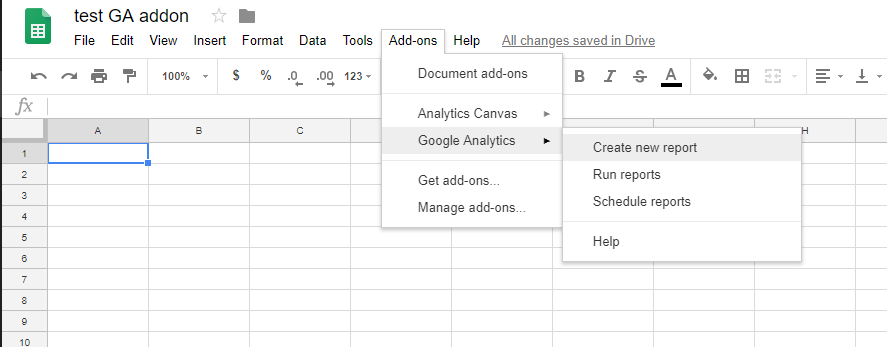
1. Click on “Create new report”

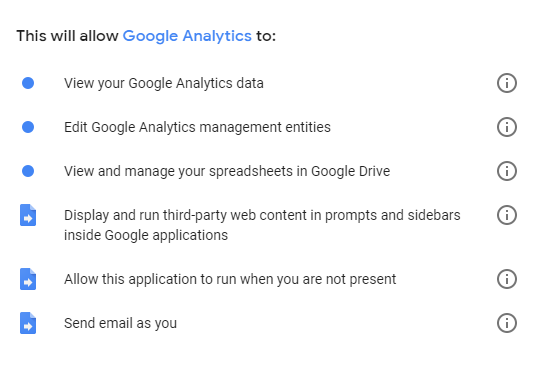
2. Allow the plugin to write in your Google Sheets and access Google Analytics reports
Review the actions the add-on needs to work and click on “allow”.
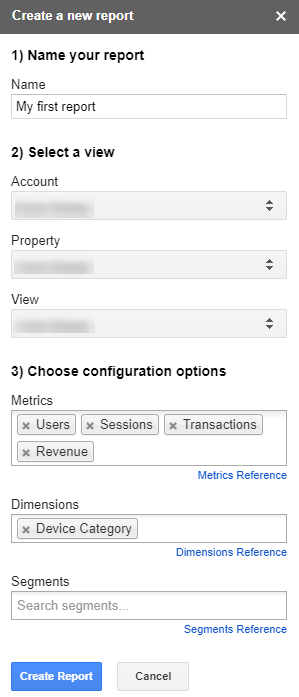
3. Fill in the required information for your first report
For your first report, choose something basic so you can see how the whole system works.
Here’s a list of the required information you need to provide.
- Report name
- Google Analytics view
- Account
- Property
- View
- Metrics
- Dimensions
- Segments
4. Run reports to pull the data
Review your settings, change something or add rules for filtering, ordering and limiting the results. Once everything looks good, go ahead and run your report.

If you did everything as is shown in the steps above, after 1-5 seconds you should see a new tab appear in the bottom of your spreadsheet named exactly as you named your first report. Go ahead, let’s take a look what’s in there.

As you see it takes into account all the information you entered in previous steps and almost instantly pulls the data from your Google Analytics account. Quite easy, huh?
If you are having issues setting up your first report, feel free to ask for help in the comments below. Also, if you managed to build something cool using this add-on, share it with others in the comments.
Now, I bet you liked what you saw so far? If this is correct, let’s take a look at how to build your own integration between Google Analytics and Google Sheets.
Building a Custom Connection Between Google Analytics and Google Sheets
Probably the Google Sheets add-on that was covered in a previous chapter will solve many of the issues you might have with the Google Analytics web interface. Sometimes, an even more customizable solution required.
Luckily, Google Sheets allows you to write custom functionality using Apps Script for altering data in your sheets. What’s even better, it has Google Analytics integration already built in.
Using Apps Script requires at least basic Javascript knowledge!
With no longer ado, let’s start building our first custom connection between Google Analytics and Google Sheets, leveraging the flexibility of Apps Script.
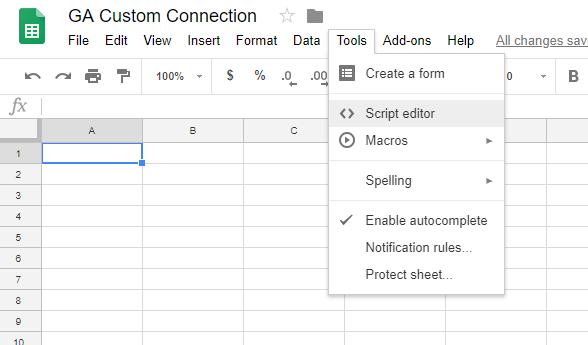
1. Open the Script Editor feature in Google Sheets
2. Allow connection between Google Analytics and Apps Script
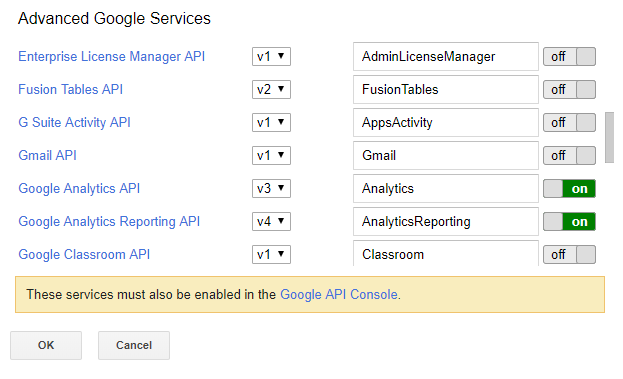
Once you are in the Script Editor, choose Resources -> Advanced Google Services. Once in the list of advanced services, scroll down to find Google Analytics API and Google Analytics Reporting API. Then turn them both ON.
Note that you might also enable the connection Google API Console. If this is required, a prompt will pop up.
3. Make your first request and print out the results
Here’s a code for a basic request that pulls data from past 30 days about sessions and transactions per each device category.
function myFunction() {
    var tableId = 'ga:123456' // Your Google Analytics view ID
    var startDate = '30daysAgo';
    var endDate = 'today';
    var metric = 'ga:sessions, ga:transactions';
    var options = {
        'dimensions': 'ga:deviceCategory',
        'sort': '-ga:sessions'
    };

    var result = Analytics.Data.Ga.get(tableId, startDate, endDate, metric, options); // Make the request

    var total_sessions = result.totalsForAllResults['ga:sessions'];
    var total_transactions = result.totalsForAllResults['ga:transactions'];

    var doc = SpreadsheetApp.getActiveSpreadsheet(); // Current document
    var sheet = doc.getSheetByName('Sheet1'); // Current sheet

    sheet.getRange('B3').setValue(total_sessions); // Write total sessions
    sheet.getRange('B4').setValue(total_transactions); // Write toal transactions

    var rows = result.rows;

    for (var k = 0; k < rows.length; k++) {

        var device = rows[k][0];
        var sessions = rows[k][1];
        var transactions = rows[k][2];

        var result_row = [device, sessions, transactions]; // Single row of results

        sheet.appendRow(result_row); // Print single row of results
    }
}
To run this function, choose Run -> myFunction. On the first run, it will ask for some permissions.
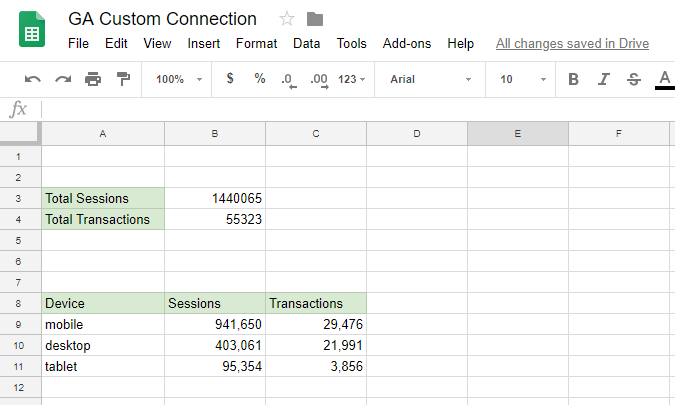
And just like magic, it will write the results in your spreadsheet.
The cells with green background were added by the user before running the funciton.
This, of course, is a very basic example of what is possible with Google Analytics, Google Sheets, and Apps Script. By playing around on your own, going through the documentation and checking code examples, you will soon be able to build any kind of automated reports straight in Google Sheets.
Something cool we have previously built was a tool that pulls data from Google Analytics and WooCommerce API and compares transactions (ID, quantity, price, tax, items etc). Whenever it finds a mismatch it would make this row red, others would be green. A perfect way for making sure your Enhanced Ecommerce setup is working as it should. We have also built a script that automatically pulls and analyses A/B testing data. Your imagination is the only limit, really.
Should you have any questions or feel like sharing something cool you have built with the technologies mentioned in this article, please share them in the comments below.