
Reflective Data Google Analytics Reports enables you to create custom dashboards based on your Google Analytics data. No need to switch between platforms.
How does it work?
After you have signed up with Reflective Data, all you need link your Google Analytics account and choose the right view.
For starters, we have created several general reports for you. These reports will allow you to get a quick overview of the most important performance indicators of your website.
Need custom reports?
We've got you covered. In Reflective Data you can create custom reports based on any metric and dimension available in Google Analytics. Furthermore, you can apply custom filters and segments.
When it comes to visualization, you currently have these options to choose from: Line, Bar, Column or Table.
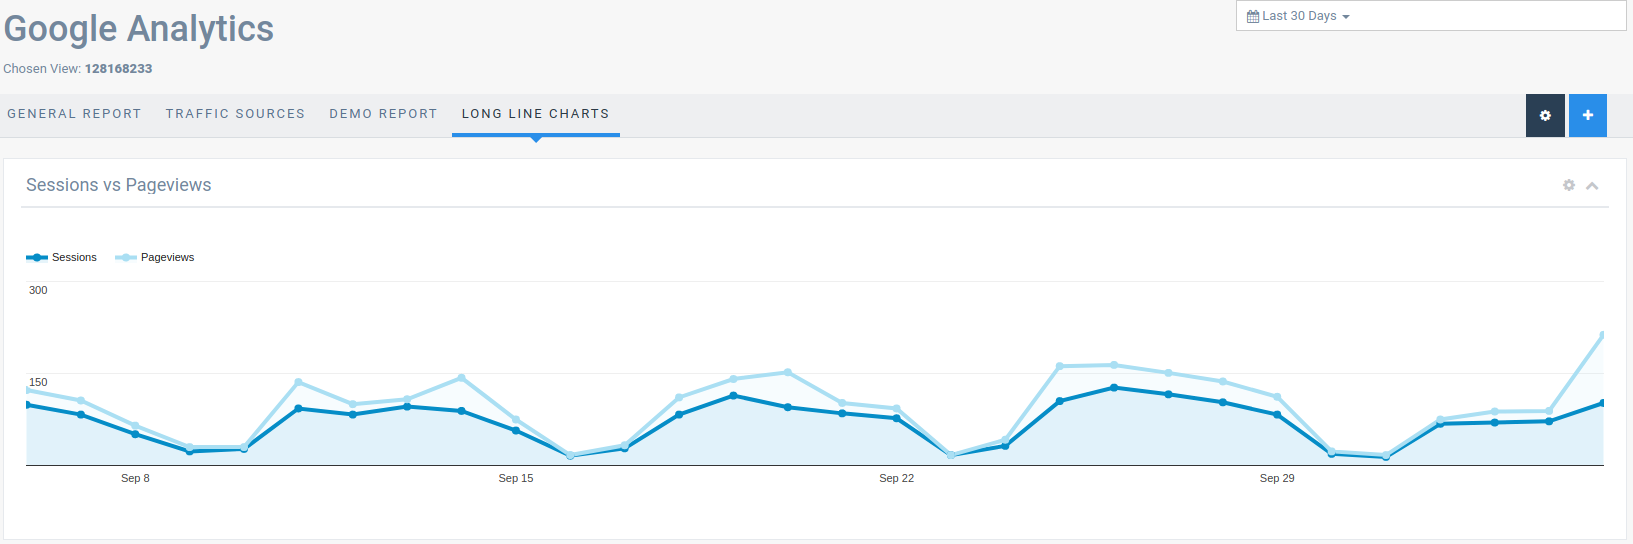
The look you are familiar with
As we are using Google Charts to visualize the data in these reports, you will find them look very close to the ones in Google Analytics.
Pick any date range
Just like in Google Analytics, you can use a date range picker to select a specific range for your analysis.

We are constantly communicating with our users and adding new features as need be. All to make your user experience better and more useful.