Get to know your customers.
Reflective Data User Behavior Analysis Software comes fully packed with all the modern features you need for better understanding your customers.
Form analytics
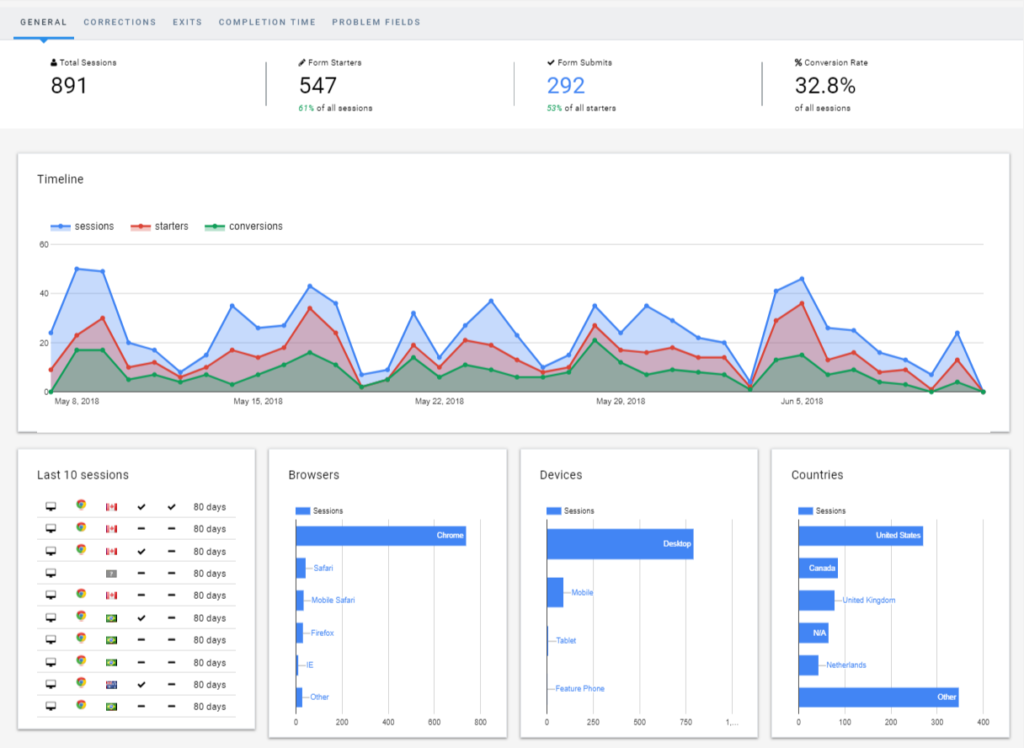
Reduce checkout abandonment and boost form conversion rates
Having a nice website is great, but it’s close to worthless if you fail at the final step due to poorly handled forms.
Do you know how well are your forms performing? Do you have a measuring system specifically designed for web forms?
Reflective Data’s form analytics tool monitors and reports on form KPI’s, showing you exactly how effective your form is as a whole, and field-by-field.
Click heatmaps
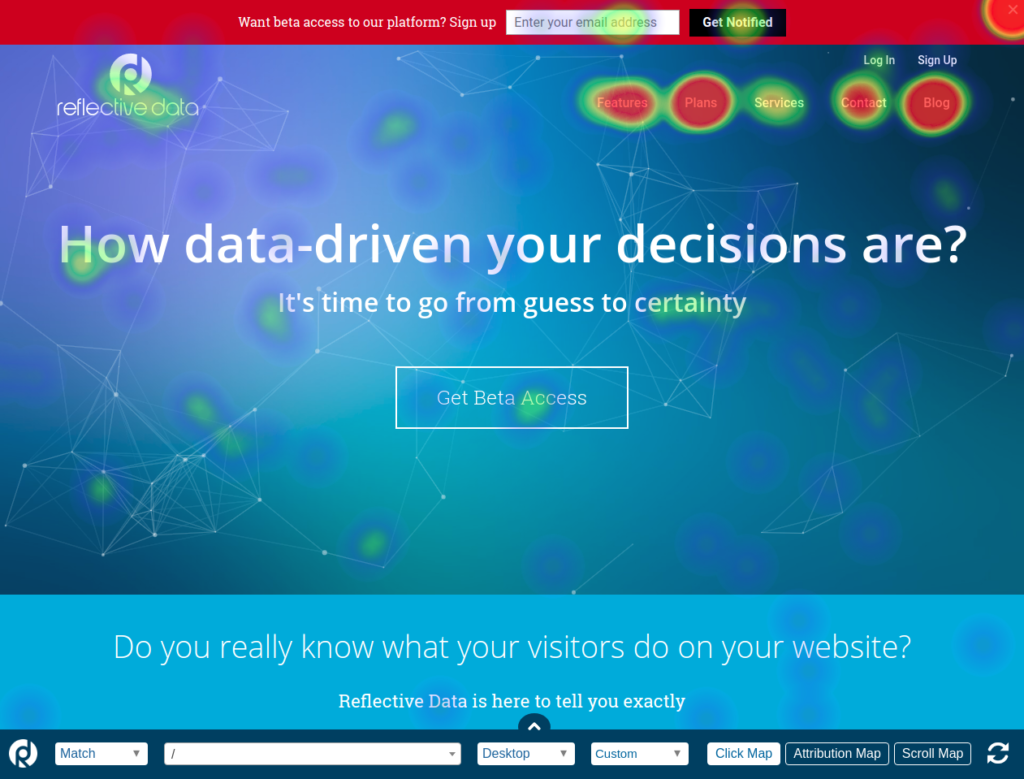
Heatmaps give you a detailed overview of how people are using your website.
See exactly which parts of your site get the most attention and if there’s something that no one seems to notice.
Reflective Data’s Heatmaps are an essential part of your website optimization.
Heatmaps are known as one of the easiest ways to get insights on how people are actually interacting with your website. And knowing how your website is being used is a crucial part of any improvement you are going to make.
Scroll heatmaps
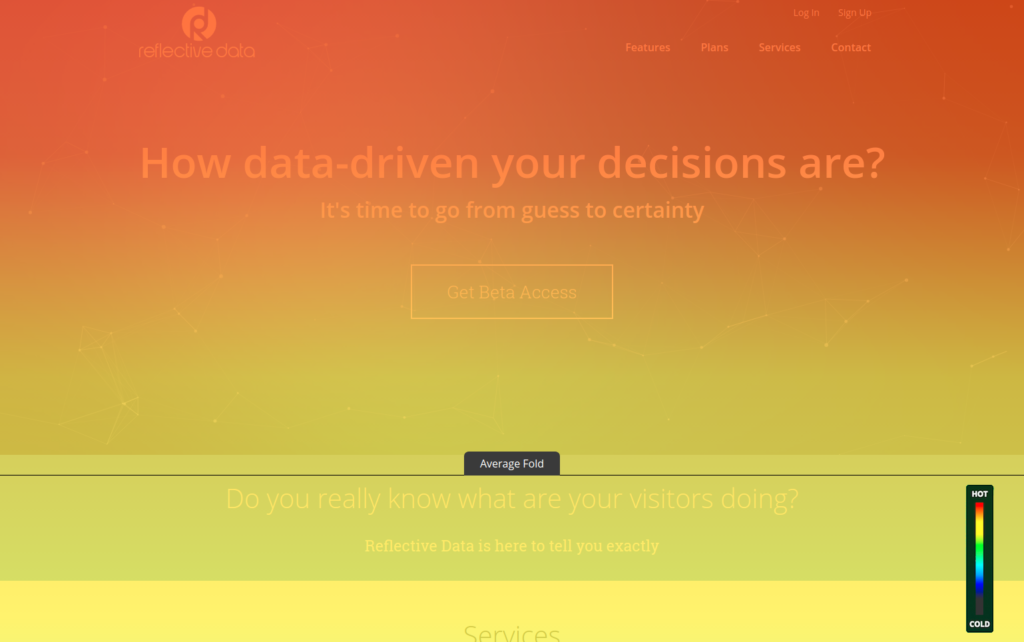
Scroll Maps work together with Heatmaps to give you even more detailed overview of which parts of your website are being seen the most, and which parts not so much.
Combine this data with other metrics on Reflective Data to figure out which information should be relocated, changed or maybe even removed.
Scroll Maps have proven to be useful on every type of pages that are longer than the “fold”. No matter whether it’s a blog post, sales page or a product page – Scroll Maps shows exactly how often certain elements are being seen.
On site polls
Let your visitors say exactly what they want
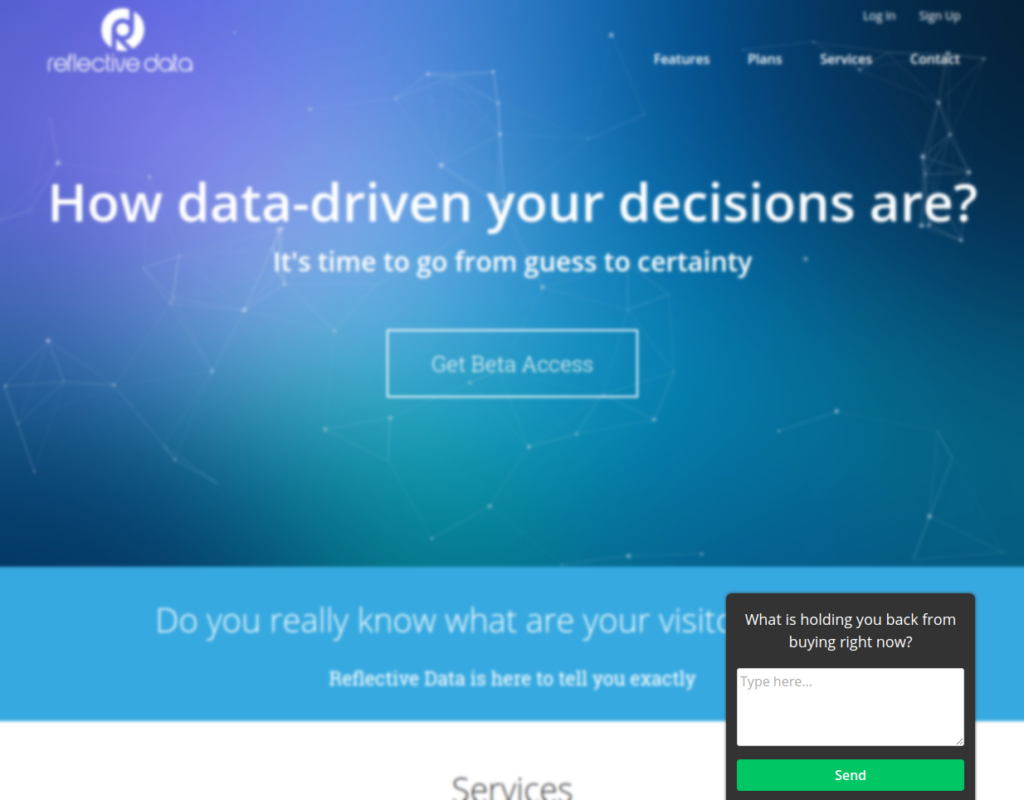
On Site Polls are the fastest way to find out what the visitors really want.
Collecting quantitative data is essential for optimizing your website but if you really want to give your clients an experience they are looking for, then our On Site Polls feature is the way to go.
For example: On a product page you could ask them: “What holds you back from adding X to Cart?”
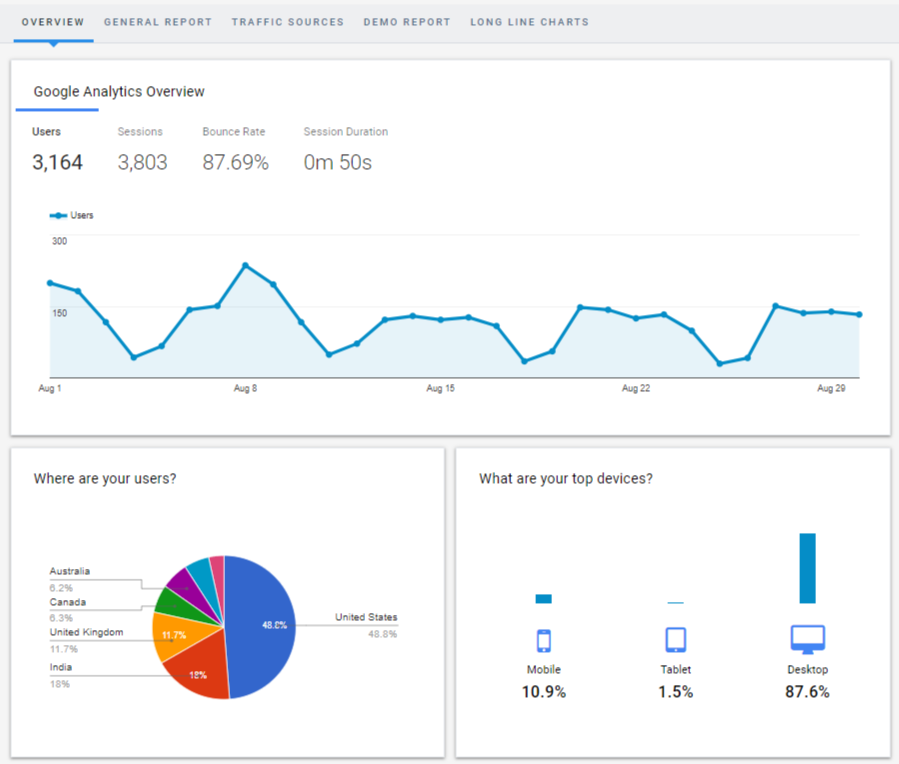
Google Analytics Reports
Google Analytics is definitely one of the greatest and most popular tools in digital analytics.
With Reflective Data, you don’t have to jump between platforms, rather you can build all your reports right in our tool.
Just like in Google Analytics, you can choose all different metrics, dimensions, segments etc.
To get you started, we’ve built some general reports for you.
User engagement
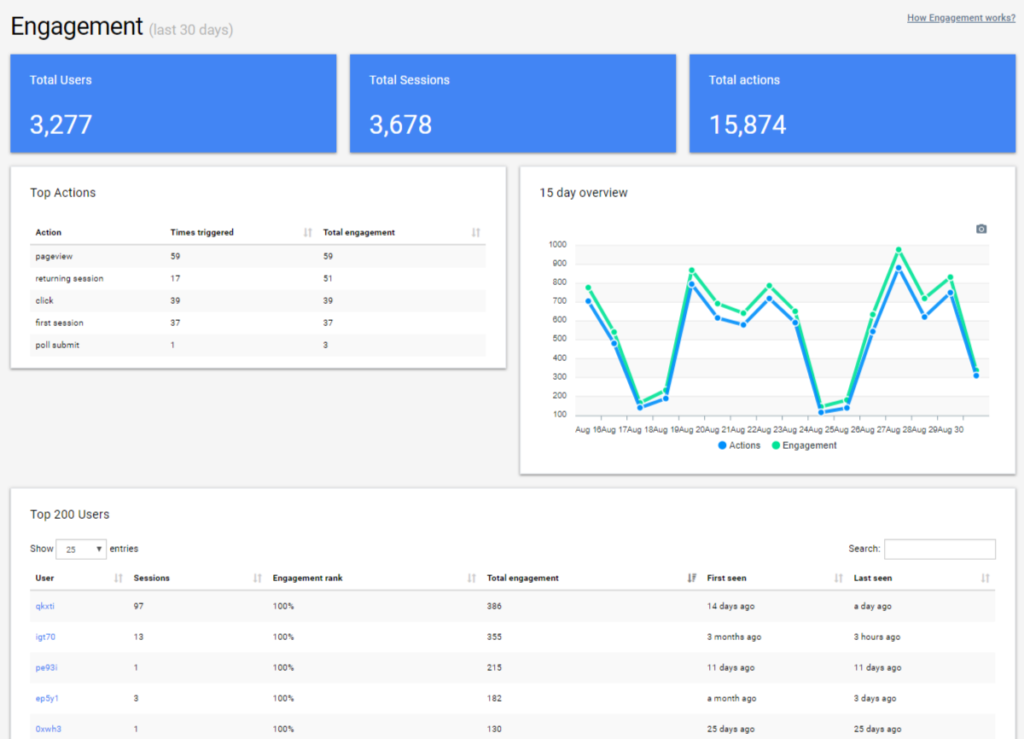
If measured correctly, user engagement can easily be one of the most important behavioral metrics.
Reflective Data automatically collects common engagement-related datapoints and calculates meaningful engagement rankings.
To make the feature even better, you can easily define your own actions and give them values from 1 to 10.
User engagement gives you a unique opportunity to dig into user level data and find actionable insights in minutes.