How does it work?
Every website is different. We built our tool to be robust and flexible, this allows us to build the configuration that best suits your business and its customers.
1. Planning
In this step, we are working closely with your team. The goal is to figure out the KPI-s, general pain points and set some objectives.
This allows us to understand your business better and set realistic expectations for our engagement.
2. Configure tracking
Our platform provides a wide set of features, all of which we can configure to best cater your business.
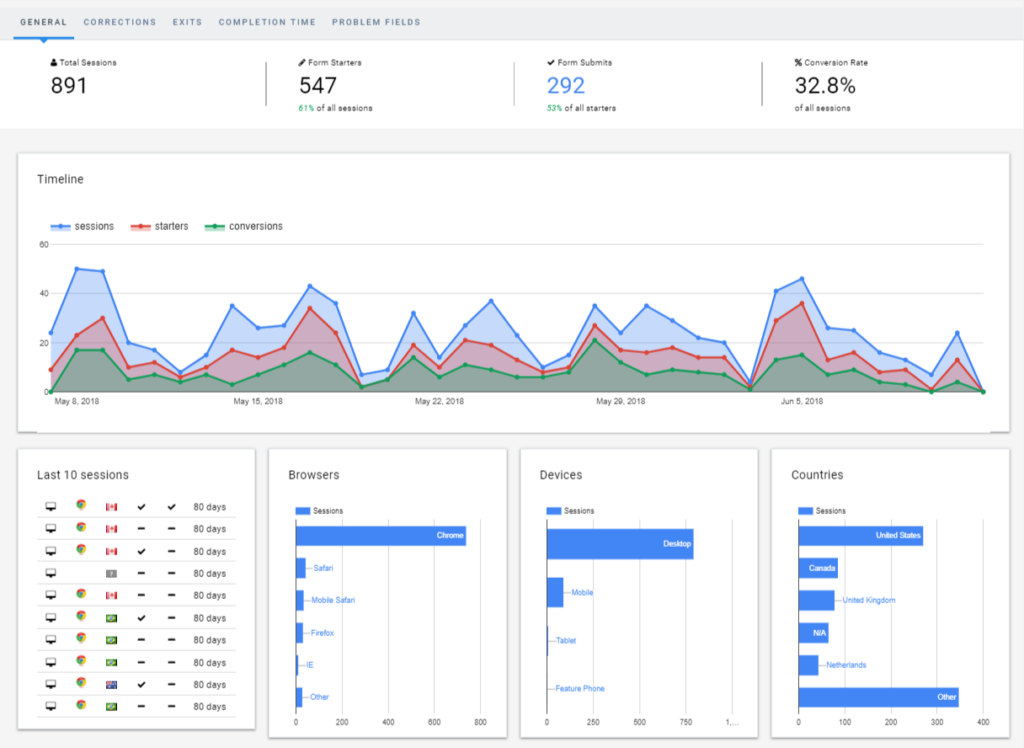
These are the default features of our platform:
- Form analytics
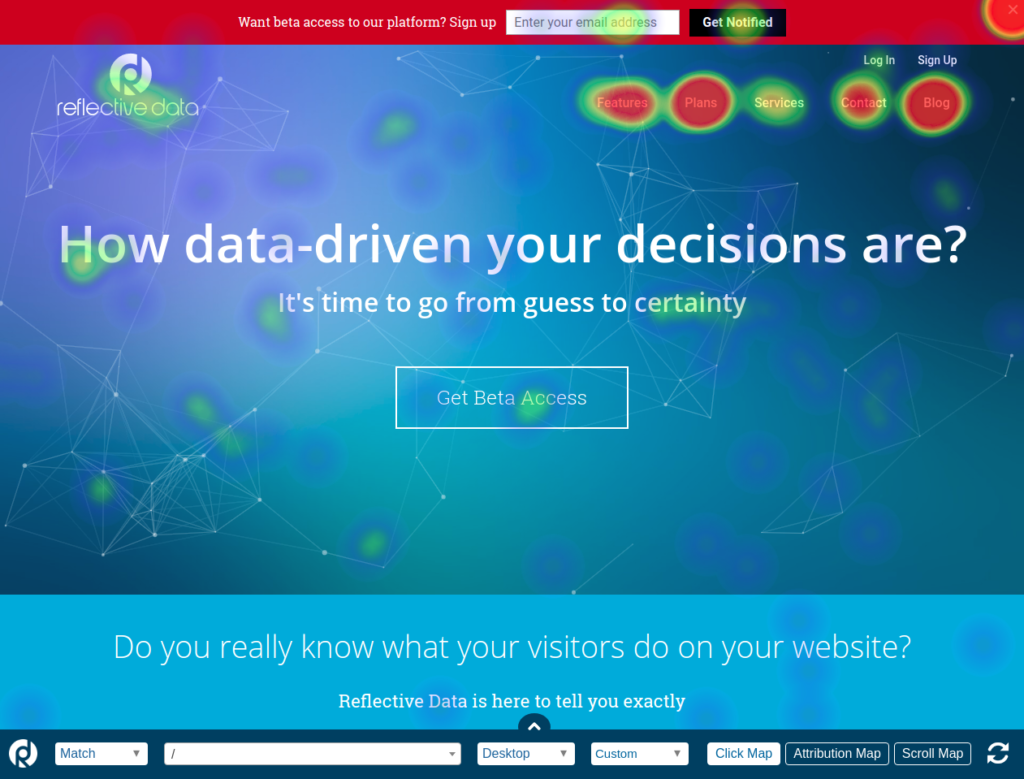
- Click heatmaps
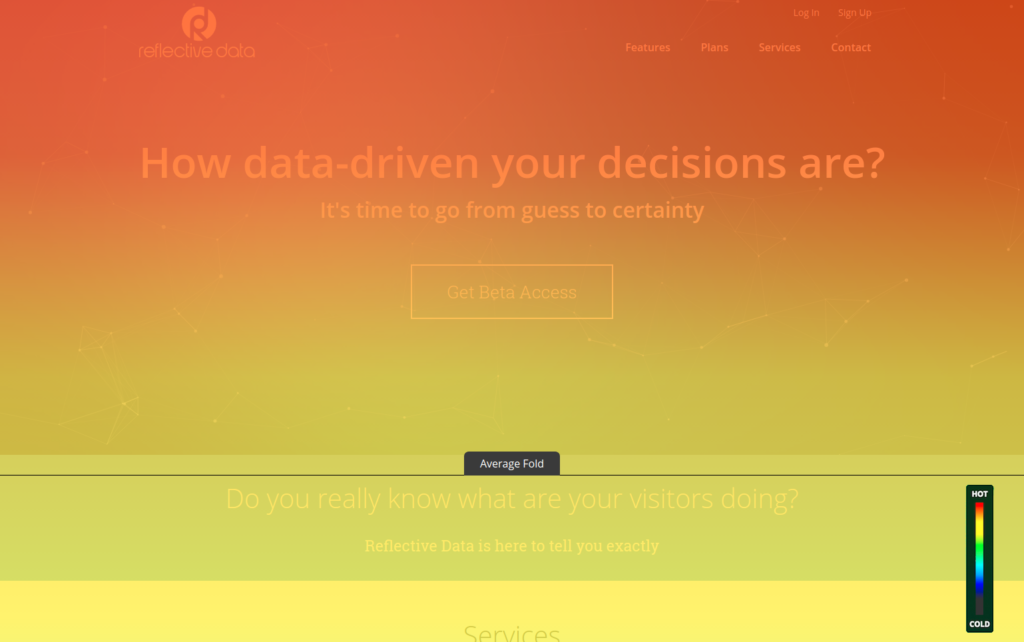
- Scroll heatmaps
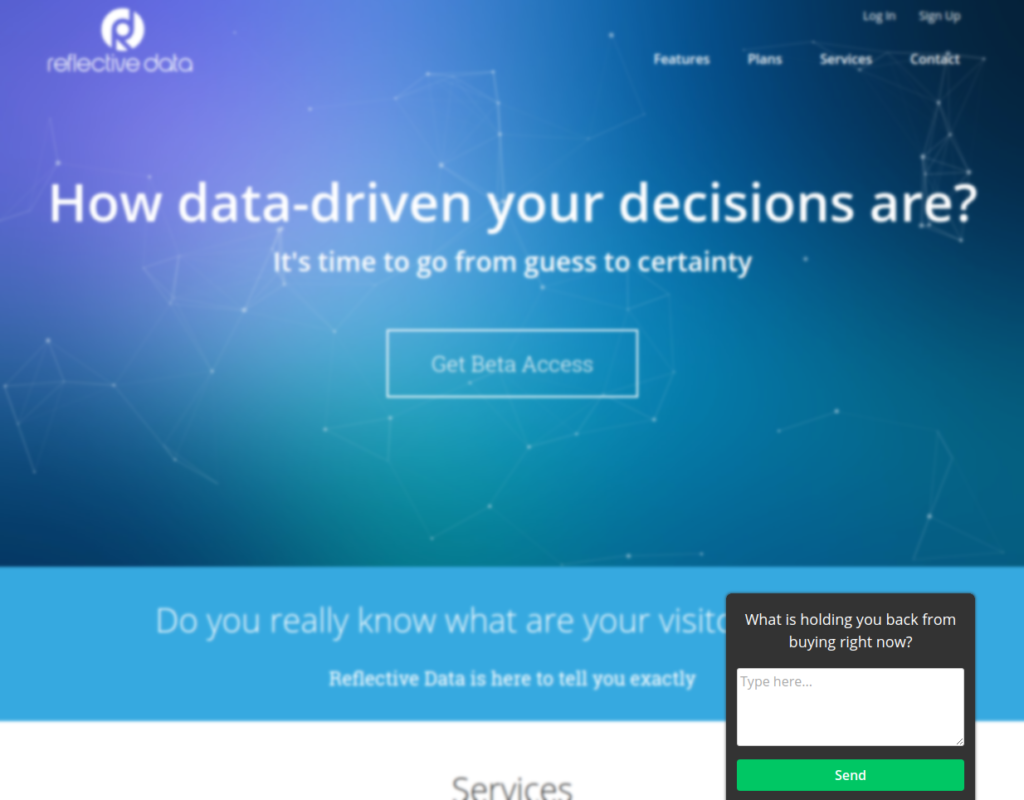
- On-site polls
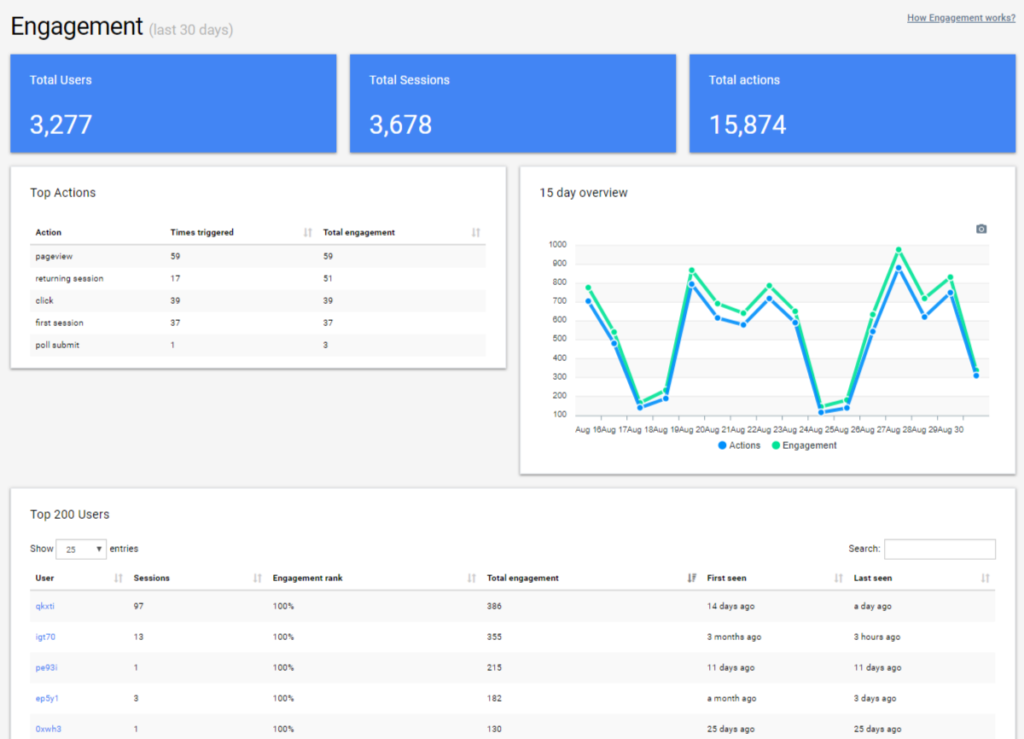
- User engagement
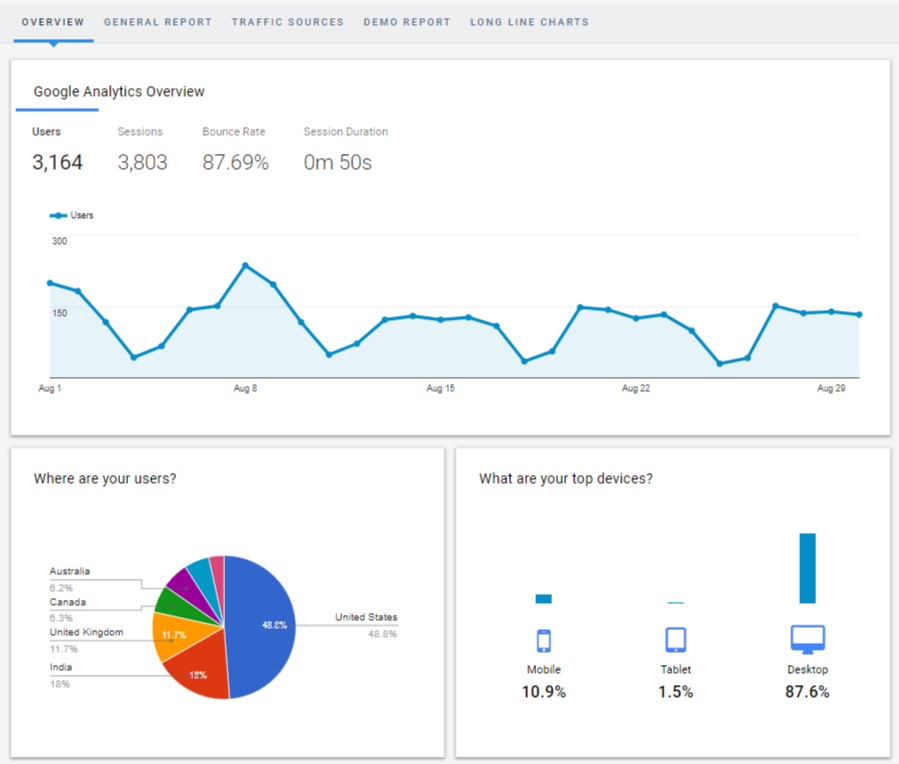
- Google Analytics reports
A more detailed description of the features can be found in the next section of this page.
3. Analysis
These days, almost anyone can set up a basic tracking tool. Analysing the data, on the other hand, requires great knowledge about the business, of how the tool works and a variety of analytical skills.
Hiring us ensures your data is in good hands and will result in useful insights that you can later use for improving your site. This makes sure your business is constantly growing and making you more profit.
4. Implementation
Our goal is to continuously provide you with the actionable insights that make the user experience better and through that, make you more money.
We can help you with the implementation of those insights in several ways. Our recommended approach is A/B testing but we can go straight to implementation, as well. The key is to measure any impact the change has on your KPIs and user behavior.