Acquisition Dashboard
This is an example of an Acquisition Dashboard built in Google Data Studio, using data from Google Analytics.

Acquisition Dashboard
This is an example of an Enhanced Ecommerce Dashboard built in Google Data Studio, using data from Google Analytics.

Google Analytics Overview Dashboard
An example of an interactive dashboard we built that helps our client get a good overview of how their site performs.

Scroll Depth
We built a fully featured scroll depth tracking, analyzing and visualization system.
Click Tracking
We built a fully featured click tracking, analyzing and visualization system.
Problematic Form Fields
This visualization gives analysts a good overview of the form fields that are causing issues in the funnel.

Form Analytics Overview
This dashboard lets analysts get a detailed overview of how a specific web form is performing on a field level.

Form Funnel
Many websites have funnels that include multiple forms, this is how we approached visualizing the funnel.

Single User Engagement
A detailed overview of the actions that a specific user has taken in the past 10 days.

Engagement Overview Dashboard
An overview of the activities that website visitors have taken in the last 30 days.

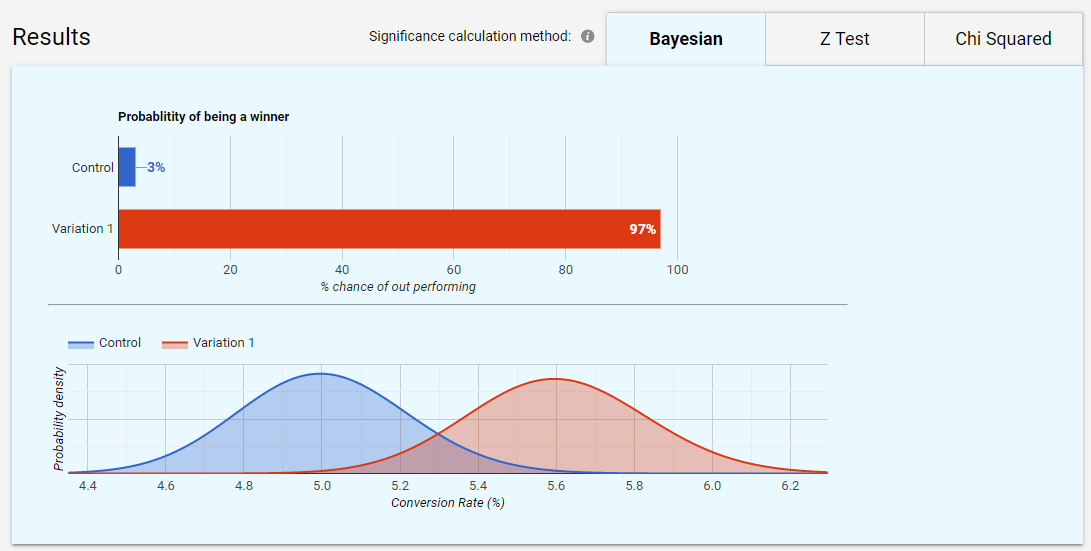
Bayesian
Results of an A/B test visualized using Bayesian Statistics methodologies.
Z Test
Results of an A/B test visualized using Z test.
