Google Charts is a JavaScript-based data visualization library that is easy to use and has a wide variety of customization options.
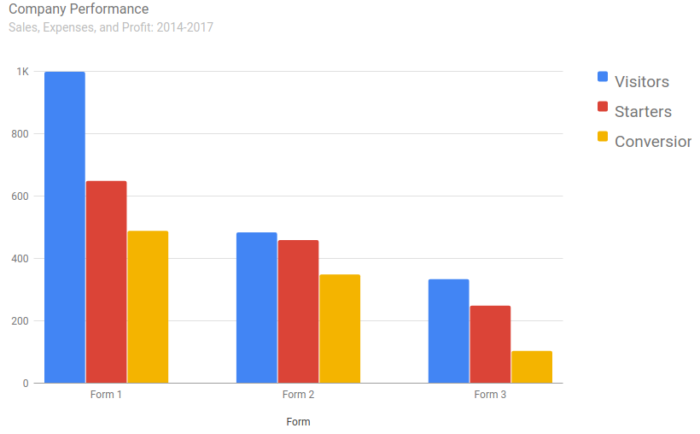
Google Charts can be run everywhere on the web. Here’s a live example of the bar chart:
And here is the code needed to create such a nice chart:
google.charts.load('current', {
    'packages': ['corechart', 'bar']
});
google.charts.setOnLoadCallback(drawChart);
function drawChart() {
    var data = google.visualization.arrayToDataTable([
        ['Form', 'Visitors', 'Starters', 'Conversions'],
        ['Form 1', 1000, 650, 490],
        ['Form 2', 485, 460, 350],
        ['Form 3', 335, 250, 105]
    ]);
    var options = {
        chart: {
            title: 'Company Performance',
            subtitle: 'Sales, Expenses, and Profit: 2014-2017',
            focusTarget: 'category',
        },
        focusTarget: 'category',
    };
    var chart = new google.charts.Bar(document.getElementById('columnchart_material'));
    chart.draw(data, google.charts.Bar.convertOptions(options));
}
As you can see, with just a few lines of code you can create a chart that looks both professional and nice to look at.
Here’s a tutorial for implementing Google Charts on every website.
Google Charts also has a very detailed documentation with a nice Chart Gallery.
Who is it for?
I would recommend trying Google Charts for everyone interested in data visualization. I am pretty sure it will find a place in your workflow. For example at Reflective Data, we use it for displaying charts in our WordPress posts.
For advanced users, I’d recommend using something very customizable, like D3.js.
In case you are an absolute beginner, take a look at WordPress plugins that allow embedding charts in your posts. There are also some tools that will let you easily create charts in image format.
Last modified: March 12, 2020
Want to see more articels like What is Google Charts? Check out all definitions in the Analytics Dictionary.