
Heatmaps will show you exactly which parts of your site get the most attention and if there’s something that no one seems to notice. This is why heatmaps are considered to be an essential part of your website optimization process.
Some people say that heatmaps are not useful enough and don’t represent the actual visitor behavior. It is easy to disprove that statement, though.
Know what you’re looking at
At first, heatmaps might look like just nice and colorful pictures that don’t represent the real numbers that should be the base for every important business decision.
Visual representations of number-based data (graphs, heatmaps etc.) are super useful to get a quick overview of what’s hidden in the actual data that has been collected. Same goes with heatmaps, they will help you quickly understand which parts of your website get the most attention and which parts seem to be ignored.
Before you start using heatmaps to make any important decisions, get to know the tool you are using. Find a documentation for the tool and make sure you know how it’s collecting and displaying the data.
Here’s the documentation for heatmaps in Reflective Data.
Pick your tool with care!
Unfortunately, not all tools are 100% reliable and there are many that fail on tracking mobile devices and dynamic content!
Types of heatmaps
There are three most popular heatmaps that many of the user behavior tools have built-in.
Click Maps

Click maps show you exactly where your visitors clicked the most (and least). This includes clicks on all elements, including text, images, buttons, and others.
It helps you almost instantly determine the areas that are getting the most of the attention and if there are any that should be getting more.
Attribution Heatmaps
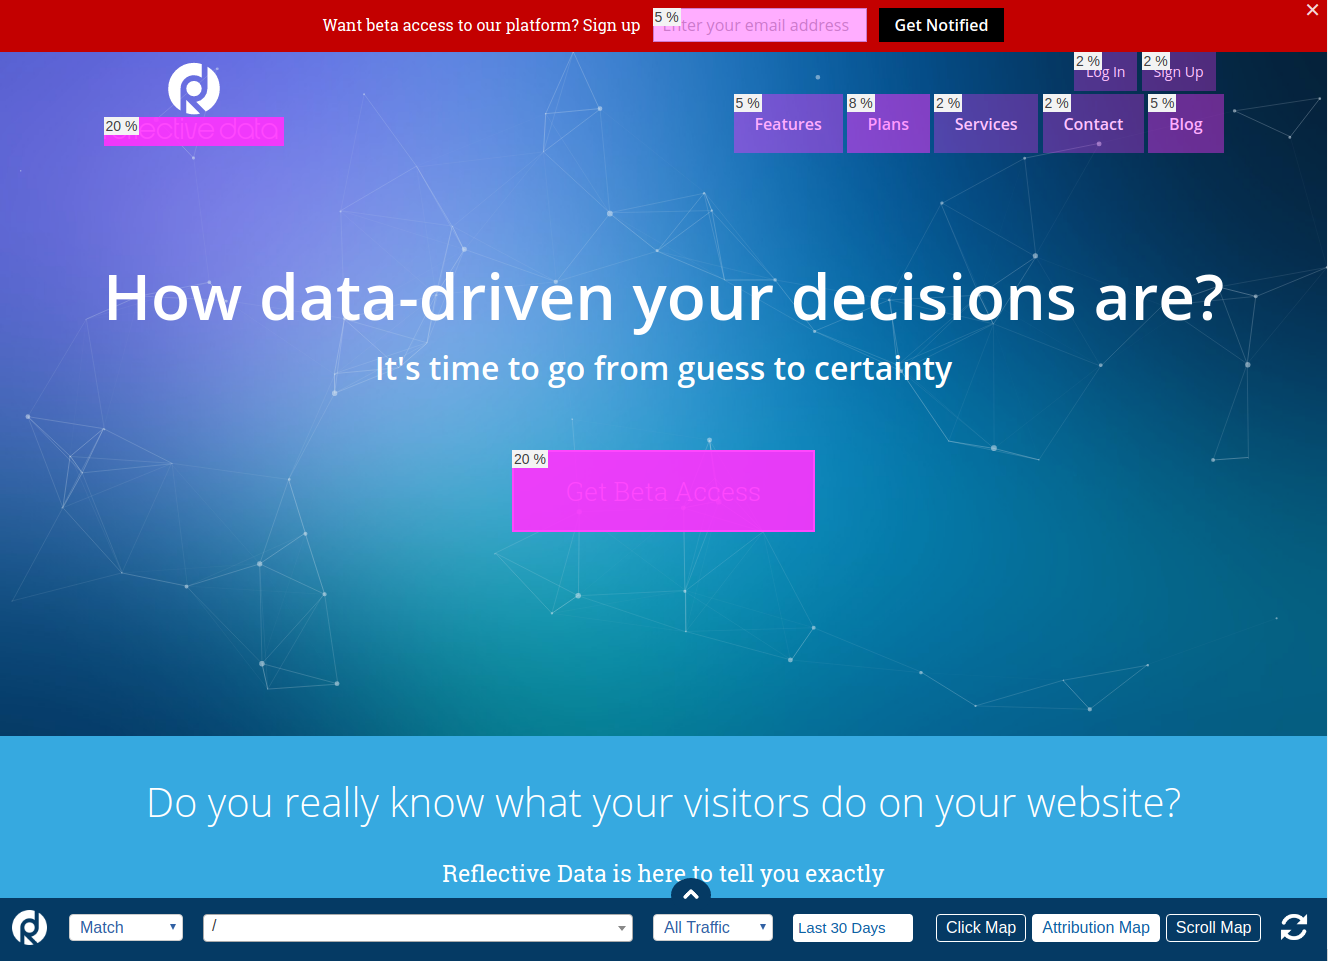
Much like click maps, attribution heatmaps represent where visitors click the most. The difference is that in this version the elements are represented, in most cases also the percentage is visible next to the element.
Scroll Maps

Scroll maps show you how long down the page visitors scroll, page by page and on average. Reflective Data’s scroll maps feature also shows where the average fold is.
Make sure that the most important information is above the fold and everything else that’s necessary is as high as possible.
Who should be using heatmaps?
Firstly, everyone who’s focusing on improving website’s usability and performance. Secondly, those who want a quick overview of how their website, sales page or a campaign is performing behavior-wise but don’t have the time or skills to dig into the numbers.
If you have a website (or work with websites) and you haven’t tried heatmaps, do it now! It’s going to change the way you work!
Last modified: April 27, 2020
Want to see more articels like What is Heatmaps? Check out all definitions in the Analytics Dictionary.