Visitors rage clicking on certain elements on your website is a good indicator of a UX error. For example, people may click on a blue text that is not a link or on an image that has no click functionality.
Author: Silver Ringvee
I thought it would be nice to combine a list of our blog posts that Google Analytics has shared on social media.
First of all, thank you Google Analytics for sharing our content with your audience!
If you have any experience with JavaScript-based A/B testing and/or personalization tools you know that flicker can be a real headache.
In case your tool of choice is Google Optimize, you should be using their official anti-flicker snippet to minimize the flicker effect.
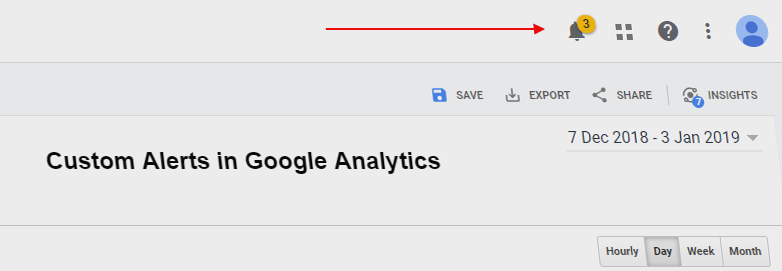
Today, we are taking a look at a really useful but often underused feature in Google Analytics.
Custom Alerts – an alerting system in Google Analytics that makes sure you get notified whenever something unusual happens with your website’s metrics.
While it was originally built for tracking general marketing and ecommerce websites, Google Analytics can be configured to track your SaaS app as well. After building tracking setups for 11 different SaaS tools, I can say that Google Analytics excels in tracking SaaS. In this article, I’m giving you a bunch of practical guidelines for doing the same with your own (or your client’s) SaaS app.
Depending on the type of website you are working with, it is likely that some percentage of your users are using their browser in incognito or private mode.
Since using incognito mode can skew the numbers you see in analytics, it is really good to know the estimated percentage of visitors that prefer to stay incognito.
Let’s be honest, most companies don’t really think about nomenclature when it comes to setting up their tags, goals or A/B testing experiments. And that creates a horrible mess that will steal your teams valuable time and makes sure no-one really knows what’s going on.
At Reflective Data, when we start working with a new client, we always start by figuring out what their current system consists of — and in many cases, it’s a real headache. Not to mention, when we ask the client about a specific tag or goal that they set up 6 months ago, they don’t remember anything — and the name they chose isn’t helping much either.
I guess it’s more or less true with every industry, especially with those related to the internet. There are two kinds of service providers, those who promise the world but hardly deliver anything useful, and those who actually put their hearts in and do whatever it takes to deliver something the client really needs.
While today I’m focusing on digital analytics implementations, perhaps most of you can share the experiences from general web development. I’ve been a part of over 50 web projects, from zero to something and here’s something I’ve seen way too often.
Running a basic A/B test is easy, but you know what else is easy? – Misinterpreting the results.
In this post, we are covering the common statistics terminology and models, and taking a closer look at the different methods of calculating A/B testing related metrics.
Depending on whether you are using the free or 360 version of Google Analytics you get 20 or 200 custom dimensions and metrics to work with.
When used correctly, these custom definitions can be one of the most useful custom features in Google Analytics. They allow you to tailor your analytics to meet your needs and to match your KPI-s.
One of the most common problems related to custom definitions has been that people don’t know what exactly are the dimensions and metrics they should be tracking.


