While it was originally built for tracking general marketing and ecommerce websites, Google Analytics can be configured to track your SaaS app as well. After designing and implementing tracking infrastructure for 14 different well-known SaaS businesses, I can say that GA4 excels in tracking SaaS. In this article, I’m giving you a bunch of practical guidelines for doing the same for your own (or your client’s) SaaS apps.
When working with SaaS clients, quite often what we see is that they have a solid Google Analytics setup on their marketing site and registration funnel but tracking the app itself is not configured properly or is missing completely.
Truth be told, I have to say that most of our clients still had some tracking in place using another (perhaps more SaaS-focused) analytics platform but why miss the opportunity of collecting everything in one place. Using a free tool.
PS! In this post we are trying something that we think should be part of almost all technical analytics posts, guides and tutorials. That is, including a few real-life examples of reports you can build using this newly collected data.
Quite often we see companies with their fancy analytics implementations while having no clue how to turn data into useful insights.
The problem
The reason why most SaaS apps don’t have useful Google Analytics tracking is that, out-of-the-box, it is quite useless. Many SaaS tools are single-page applications (SPA-s) and tracking them properly requires a bit more work than implementing the snippet. Another thing is that tracking screen/page views in SaaS apps is useful but definitely not the most important thing. When it comes to tracking SaaS platforms, it is much more about the events or actions that users take while using it.
There are tools like Mixpanel and Keen that are much more focused on event-based tracking and analytics, and by no means, are they bad choices. But before shopping for a paid tool, evaluate the free one that your team is (probably) already familiar with. Believe me, a small to medium SaaS app can track everything they need using Google Analytics.
If your marketing site already has Google Analytics configured, having it in the SaaS app gives you a really good and complete dataset of your visitors’ journey from their first visit to the point where they sign up and later when they use your app.
Working out the strategy
As I already mentioned, Google Analytics was built for general-purpose and ecommerce websites. You will find most of its features and even online tutorials focusing on those use cases. That, although, doesn’t mean that it couldn’t track SaaS really well. too. In fact, Google Analytics is a really robust tool and I’ve seen much stranger use cases than tracking a SaaS app. And when I say strange, I mean tracking your dog’s location using GPS and Google Analytics kind of strange.
Every SaaS app is different, and likely more so than average ecommerce or marketing websites. Therefore it is really difficult to build an analytics platform that does everything for you. You and your team know your app the best. In order to get the most out of your Google Analytics setup, you need to sit down and plan out your tracking strategy.
How I usually approach working on the strategy is by getting familiar with the SaaS app itself, all of its features and possible actions that its users can take. For more complex apps, it’s worth creating documentation or working with the existing one.
Next, I would create a spreadsheet and list all the things I want to track using Google Analytics. It helps if you can categorize them by something that makes sense in your app’s context. Here’s an example of the categories we used for one of our clients.
- Page/Screen views (sent using virtual pageview)
- Messages (popups/alerts the user sees in the app)
- Success
- Error
- User actions
- Clicks
- Downloads
Next, list all the events under those categories.
When you’re done listing and categorizing the events, move on to list all the custom dimensions and metrics you can collect about your users and their actions. Here’s an example.
Dimensions
- User ID
- Account ID
- Account name
- Account type/plan
- Original page path (see below for explanation)
- Feature (from which feature the hit came from)
Metrics
I recommend tracking all of your most important user actions using both custom events and custom metrics.
- Created new project
- Update the project
- Updated user settings
- etc.
Of course, all of the other useful custom dimensions and metrics, such as session ID and hit type, also apply here.
Now that you are done with planning both events and metadata, think of how you would like to see this data in your reports. Or what kind of reports you are going to build. This can be tricky to foresee, so just go with something that’s robust and makes the most sense to you. Discuss with your team for ideas.
This is especially important when deciding what goes into custom events’ category, action and label fields. In general, the usual best practices apply here, too.
Category: For categorizing your events, take a look at your spreadsheet and the high-level categories you listed there. (i.e “user actions”)
Action: For describing what happened or what action did the user take. (i.e “click”)
Label: For describing the specific event and giving more context. (i.e “Save project”)
Unless there is a good reason not to, I recommend sending all relevant custom dimensions with all hits. Sending custom metrics depends on your setup, tie them together with related events.
Configuring the setup
Hopefully, now you have a decent strategy and it’s time to start working on the setup itself.
This includes parts where developer help is required so keep that in mind. Luckily, there’s nothing too complex or time-consuming, though.
Google Tag Manager
While it’s not 100% needed, I recommend setting up your SaaS tracking using Google Tag Manager. That goes for any Google Analytics setup really.
Perhaps you already have a data layer configured for your SaaS app for some other analytics tool so you can use that. And if you don’t have your developers set it up and explain them the importance of it and how it will save lots of time and nerves in the future.
Pushing data to the data layer
When pushing data to the data layer, I recommend using the same logic you have planned for your Google Analytics events.
With every push that should initiate a Google Analytics event-sending process, provide an event value. This makes building your triggers in the tag manager much easier.
Sample data layer push: window.dataLayer.push({'event': 'userAction', 'eventCategory': 'userActions', 'eventAction': 'click', 'eventLabel': 'save-project'});
Accessing data from the data layer
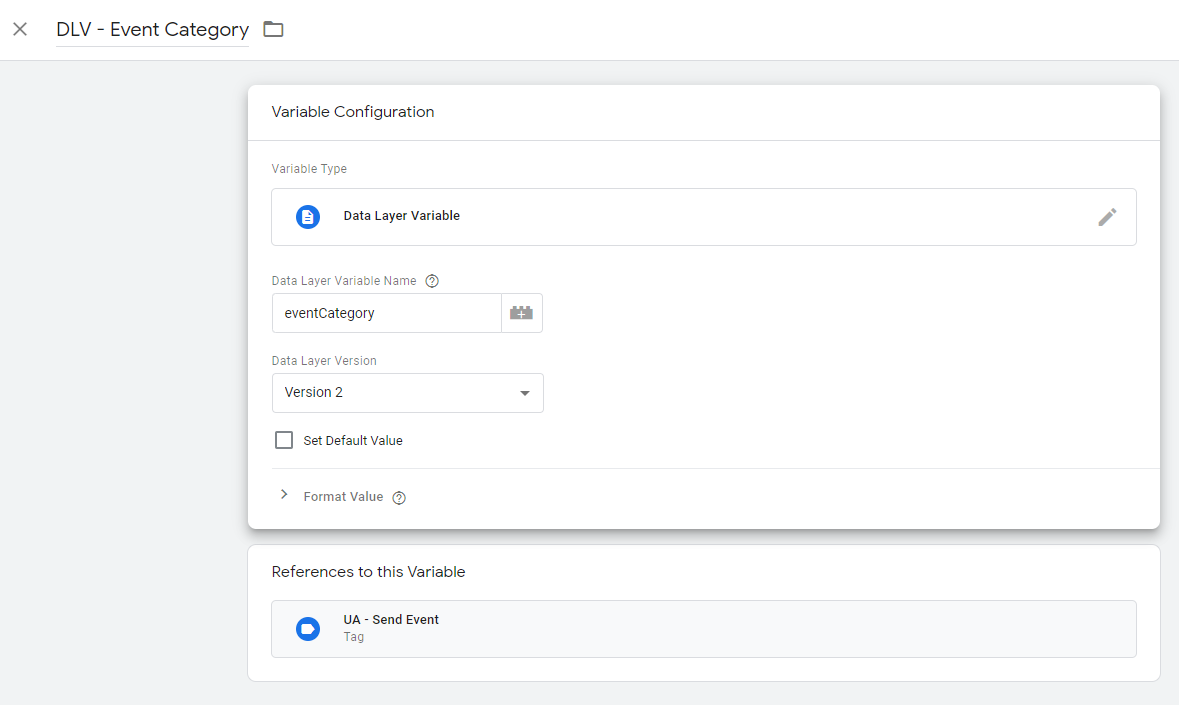
Now that you have all the important information available in the data layer, it’s time to make it accessible in Google Tag Manager by creating variables.
We are creating 3 new variables, one for event category, one for actions and one for labels. Variable type for all three is Data Layer Variable.
Sending events to Google Analytics
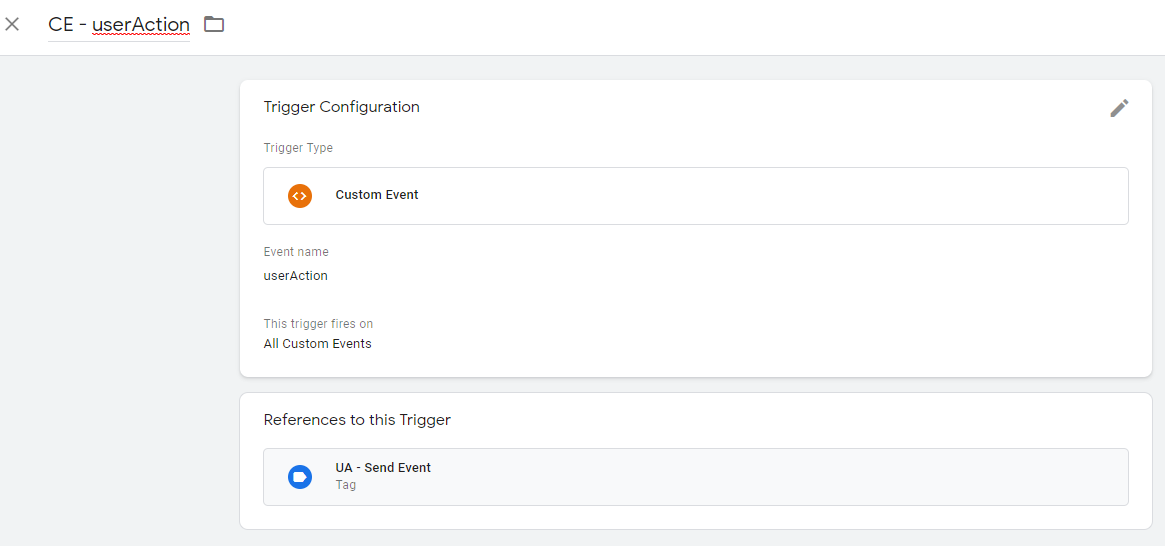
First, we need a trigger that we can use to determine when we want to send the events.
In most cases, we can use the event value from our data layer push.
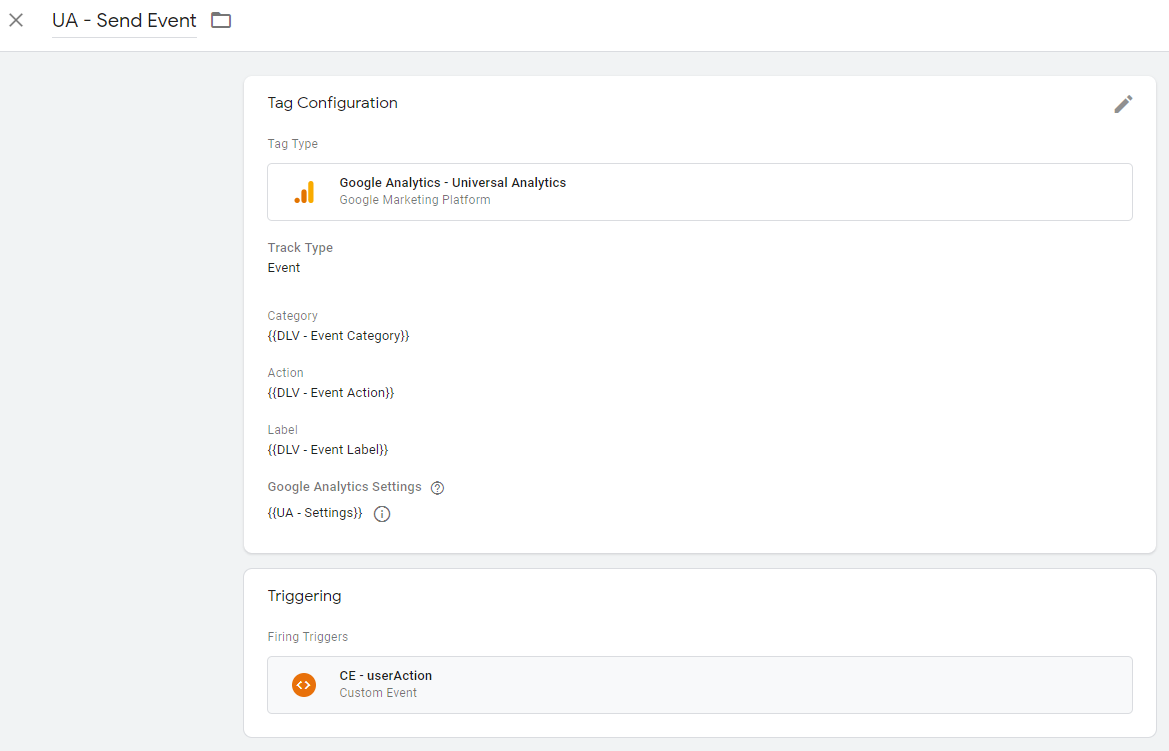
Now that we have our trigger ready, it’s time to set up the tag responsible for sending the custom event to Google Analytics. This is quite straightforward for anyone with even minimal experience with Google Tag Manager.
Page/Screen views
Since most SaaS apps are SPA-s, tracking pageviews will be configured using virtual pageviews which work pretty much like a normal pageview, the main difference is that they are not sent on page load but on some other trigger, i.e history change.
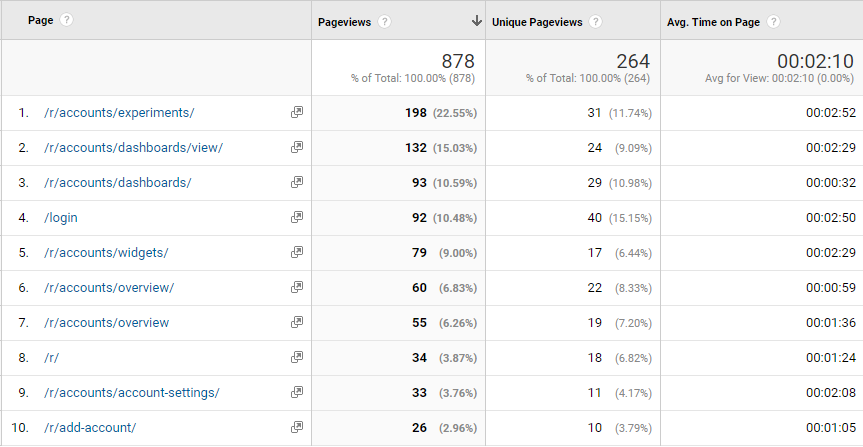
If your URL paths have dynamic elements like ID-s, I’d recommend removing them from the page path of your Google Analytics pageview. This results in much cleaner reports and having the ID-s there has very little value. What we recommend, though, is sending the original path as a hit-level custom dimension with every hit.
This is how the cleaned page paths look like in your general reports.
And this is how you can still see the original path using a custom dimension and custom report.
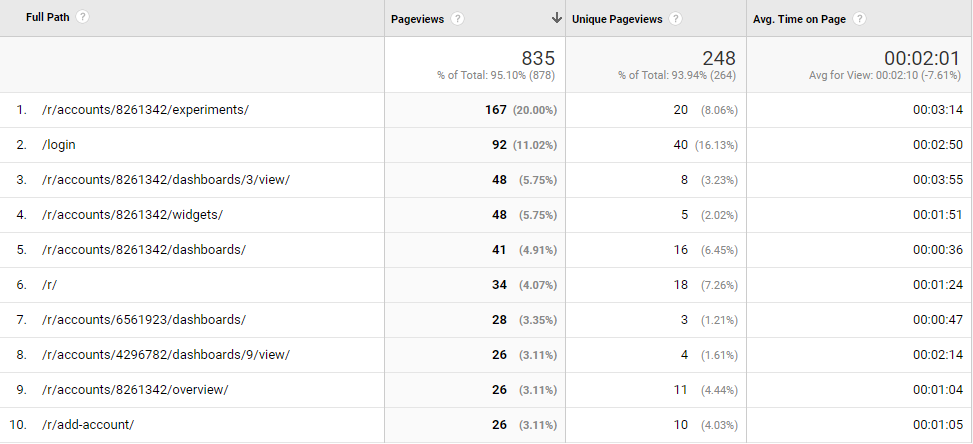
As you noticed, in the first screenshot the page paths were nice and clean and in the one below they still contained the original ID-s. While the second one can be useful in some cases, the clean one has a lot more use cases.
Example of an URL path cleaner
Original URL: http://reflectivedata.com/r/accounts/9735757/dashboards/10/view/
Original path (send using a custom dimension): /r/accounts/9735757/dashboards/10/view/
Clean path (send using a virtual pageview): /r/accounts/dashboards/view/
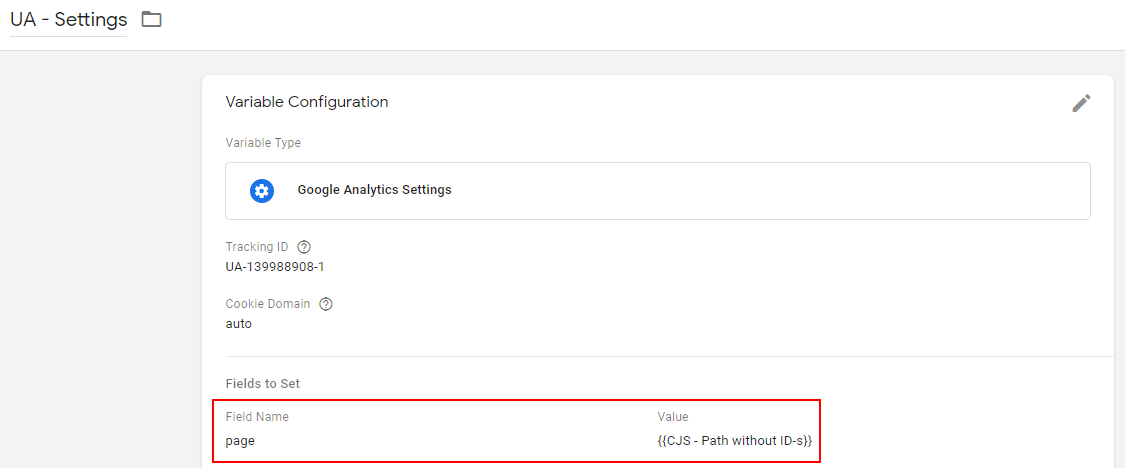
You can clean the path quite easily in Google Tag Manager, here’s an example.

You can then use this variable to overwrite the page value in your Google Analytics Settings variable.
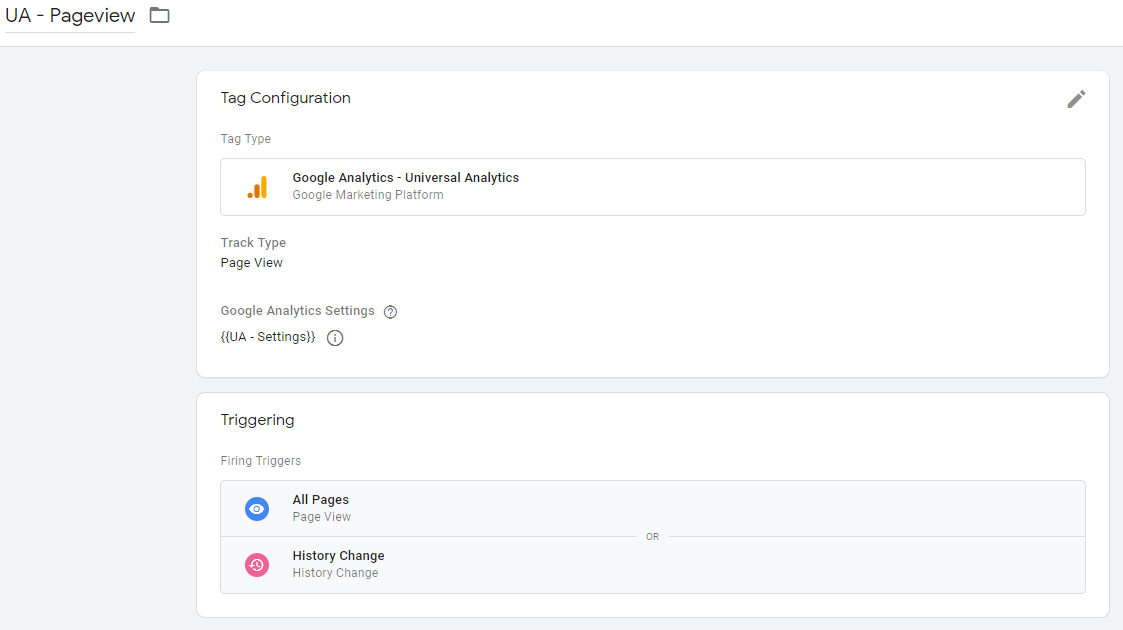
When sending pageviews from a single page application, you can’t use the default “All Pages” trigger for sending your pageviews. Luckily, the built-in “History Change” trigger works well in most cases. But always do your testing before publishing.
You should be good with something like seen in the screenshot below. This triggers a pageview on the page load and then every time the history changes.
In SaaS apps, it can sometimes be difficult to decide what should be tracked as a pageview. Many apps have popup modals, slide-in panels or something else that essentially replaces a regular page view. There is no right or wrong approach to this but make sure you track everything that matters, either via pageviews or custom events or both.
Tracking payments
In most SaaS apps, you will have two types of payments. Those that take place immediately after the user performs a certain action like inserting their credit card information or changing their plan. And then there are recurring payments for subscriptions, these take place without the user doing anything.
Tracking immediate transactions is quite straight forward and I recommend using Google Analytics Enhanced Ecommerce features that provide a nice structure to your data as well as make reporting a lot easier.
Tracking recurring payments, on the other hand, can be quite tricky in Google Analytics. Nevertheless, here’s a broad overview of how I would approach doing it.
- Store the Google Analytics client ID in your database for every user
- Use the Measurement Protocol for sending e-commerce transaction hits from your back-end to Google Analytics
- Make sure you include the correct client and user ID-s with every hit
- Use a custom dimension to differentiate between immediate and recurring payments
- Create a separate view in Google Analytics that excludes recurring payments, this can be useful for the marketing team
Limitations
So, this all sounds too good to be true, right? A free tool that can replace most functionalities in your expensive event-driven SaaS analytics platform. I completely agree that for a large SaaS business a purposely built SaaS tracking tool might be a better option but if your business is small to medium size and you can live with the few limitations it has, Google Analytics might still be a really good option for you.
PS! These limitations are relevant only to the free version of Google Analytics, 360 users will be fine.
Sampling
It is no secret that the free version of Google Analytics samples data in your reports, especially if you look at longer time periods or use custom segments.
Sampling should not be an issue when looking at shorter time periods or overall numbers and trends. It can, however, become a headache if you are trying to analyze actions from a single user over a longer period of time – the sampling kicks in and you will not see a full set of events anymore.
One way to work against sampling is to split your queries into smaller chunks, there are tools built for that purpose, or you could build it on your own using the Reporting API.
No access to raw data
Being unable to access the raw data is a disappointment for everyone trying to do advanced analysis in Google Analytics, and when it comes to analyzing your SaaS data, it can be even more frustrating.
As I already said earlier in this article, SaaS app tracking is much more event-driven than tracking a regular marketing site. Therefore, accessing raw data can be extremely useful in the analysis process.
There are a few ways you can come closer to fixing this limitation. Namely, using custom dimensions that allow you for more detailed analysis in Google Analytics or by exporting data into your favourite BI tool. Those custom segments include.
- Session ID
- Client ID
- User ID
- Hit type
- Hit timestamp
Again, those limitations are not something you can’t live with, don’t let them put you off unless you know for sure they will be a major problem or you have already experienced them in a bad way.
Reporting examples
In this post we are trying something that we think should be part of almost all technical analytics posts, guides and tutorials. That is, including a few real-life examples of reports you can build using this newly collected data.
Quite often we see companies with their fancy analytics implementations while having no clue how to turn data into useful insights.
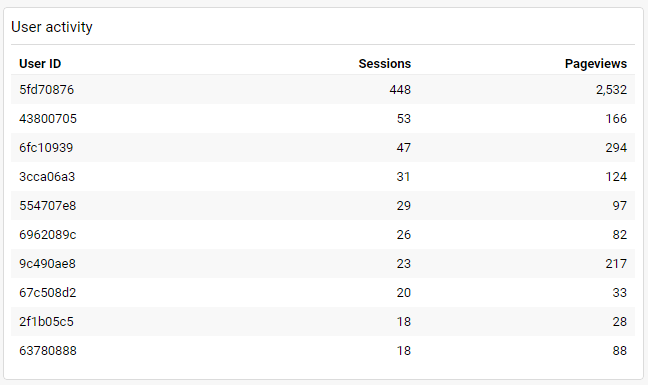
User activity
This is a really simple custom report but gives you a really good overview of your most active users. Feel free to change/add metrics to ones that make more sense to you. Count of a specific event etc.
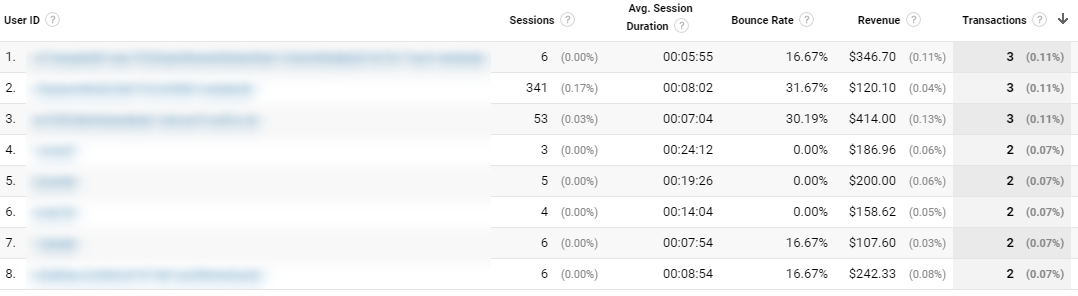
Most valuable users
There are several ways you can use user ID in Google Analytics to detect your most valuable users, one of the simplest ones is the User Explorer report under Audience.
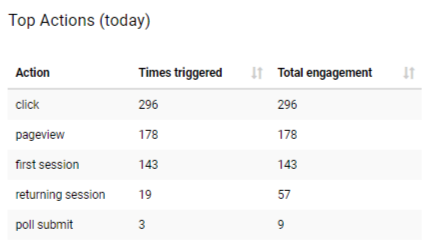
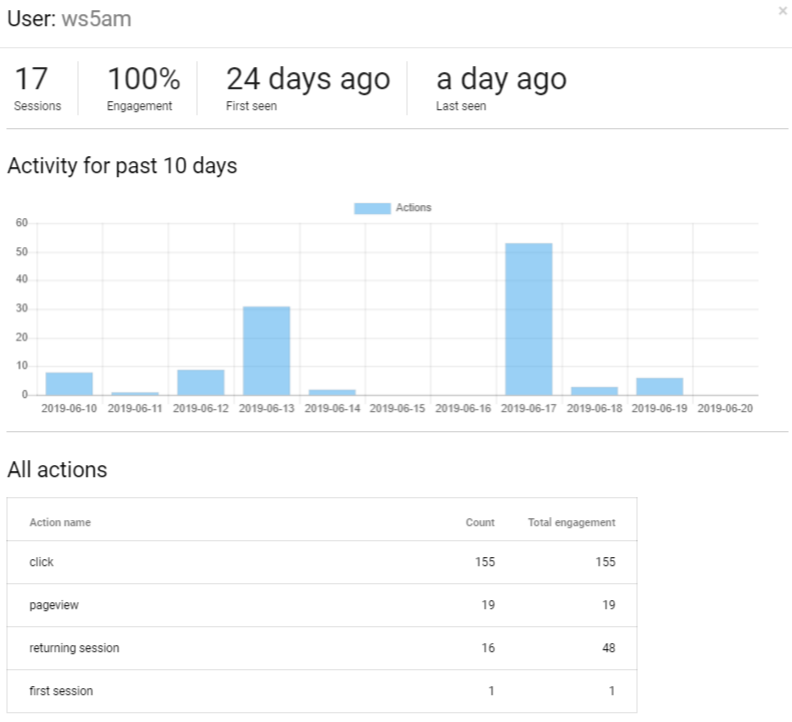
User activity and actions
If you are tracking all important user actions using custom events, you can build all sorts of useful reports in both Google Analytics and in your favourite BI platform.
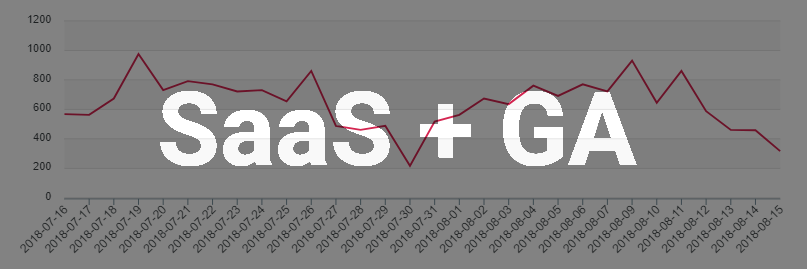
The activity of all users example:
The activity of a single user example:
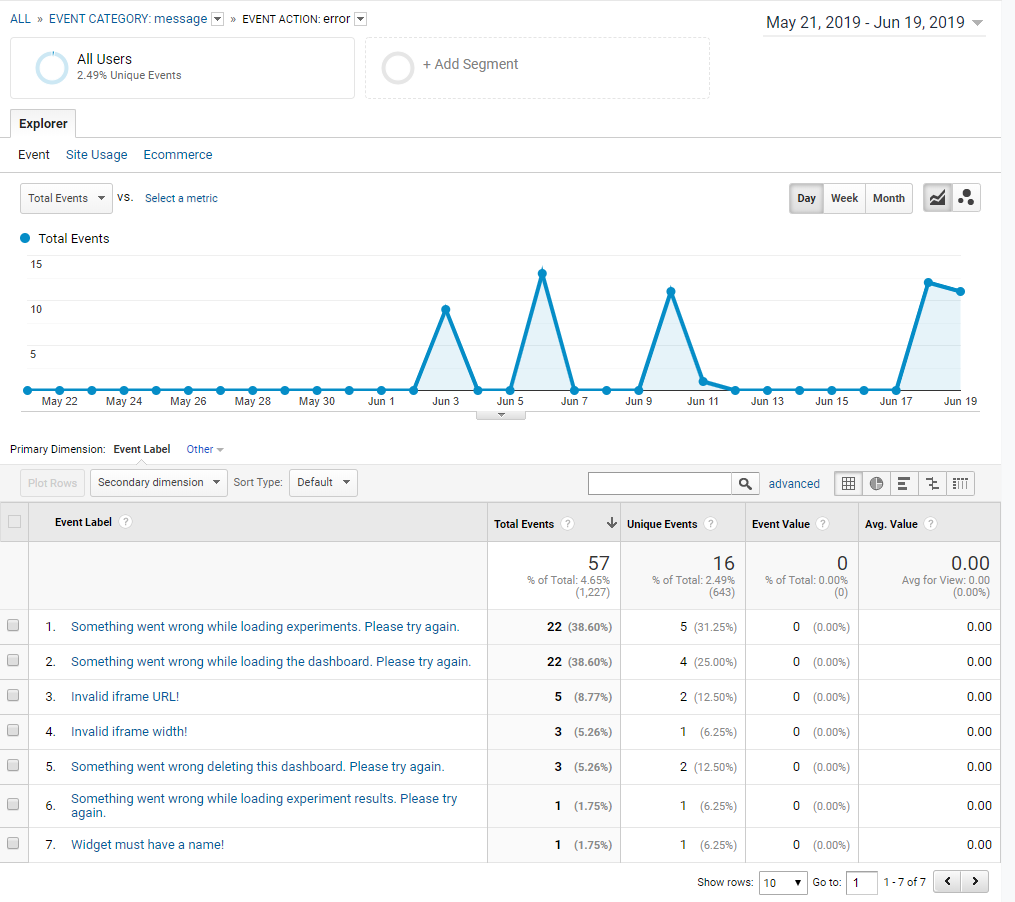
Error messages
In general, I recommend tracking two types of error messages using Google Analytics. Firstly, track all the errors and alerts the user is seeing in the app and secondly, track the Javascript errors.
Your goal should be improving the user experience and lowering the amount error messages is certainly the way to go.
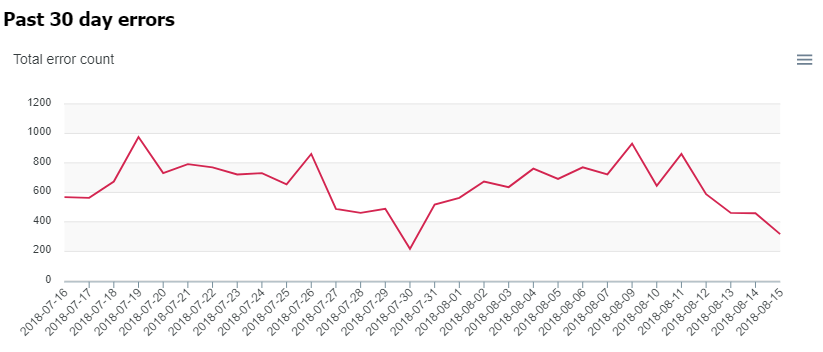
And here is a very simple way you can see which error messages are causing the most friction in the user experience. Example from one of our demo sites.
Conclusion
Google Analytics is perfectly capable of being the main analytics platform for most SaaS apps. I’ve proven this by successfully implementing it on 11 SaaS tools and there are more to come in the near future.
If you work at a SaaS company, our you work with clients in the SaaS business, consider using Google Analytics to track the usage of the SaaS app. This is especially useful if the marketing site already has Google Analytics installed and configured and/or if the team has experience with it.
And as always, should you have any questions or want to share your experiences with tracking SaaS, please post them in the comments below.
Need help tracking your SaaS business? We’ve got you covered!
7 thoughts on “Using Google Analytics (GA) for Tracking SaaS”