
SQL (pronounced “ess-que-el”) stands for Structured Query Language. SQL is a language used to communicate with databases. According to ANSI (American National Standards Institute), it is the standard language for relational database management systems. Most data analysts, data scientists and data engineers use SQL on daily basis to complete tasks related to ad-hoc queries, reporting and data visualization.
Google Analytics, on the other hand, is the most popular tool in the digital analytics world. It is used to keep track of marketing efforts, user behavior, traffic sources and more. The most common way to access data from Google Analytics is the web user interface. Alternative options include the Reporting API or external tools like Looker or Data Studio.
What’s interesting, though, is that there is no way to use the most popular query language to query data from the most popular analytics platform. That’s right, you cannot query Google Analytics data using SQL.
This is no big deal for the more basic users just checking the built-in reports in the Google Analytics UI. It is, for sure, a limitation for power users working with tools like Python and use data in custom models or even feed it into machine learning algorithms and recommendation engines.
In this article, we’re going to cover the solutions that will enable you to query your Google Analytics data using SQL.
Step 1 – Getting data into a database/data warehouse
As mentioned above, there is, unfortunately, no way to query data directly from Google Analytics using SQL. This means that the first step is to get data into some sort of a relational database or a data warehouse that support SQL queries.
There are three options for sending Google Analytics data into some external data storage.
1. Google Analytics 360 to BigQuery export
If your company has the 360 (premium) version of Google Analytics then you can use its native BigQuery export feature. Here are the details for setting this up. Keep in mind, though, that this solution will not work with the standard (free) version of Google Analytics.
2. Google Analytics Parallel Tracking
Google Analytics Parallel Tracking is a third party service that sends all of the raw hits into a data warehouse of your choice (i.e. BigQuery). These hits are then processed into sessions to provide a dataset similar to Google Analytics 360 export.
While this solution is not free, it will cost you only a small fraction of the cost of Google Analytics 360.
Getting started with Google Analytics Parallel Tracking.
3. Export data using the API
This is the most technical solution of the three. It leverages the Google Analytics Reporting API to pull data from Google Analytics and into your database or data warehouse.
One way to get started with this solution is to use the gago library in Go language to communicate with the Reporting API. Then you need the code for writing this data into your database.
The limitations with data export solution are that you can’t query all of the metrics and dimensions at the same time, you’re still affected by the data collection and sampling limits of Google Analytics and a modification in your tracking system is required (custom dimensions for hit timestamp, hit type, sessions ID, client ID and more).
Step 2 – Query Google Analytics data using SQL
This depends a bit on the setup you used to send data into a database/data warehouse and the type of data warehouse being used. Since the most common option is Parallel Tracking and Google BigQuery, we are going to use these in our examples as well.
The simplest way you can run your first SQL query against your Google Analytics data stored in BigQuery is to go into the BigQuery user interface and choose the right dataset containing your Google Analytics data.
With parallel tracking, you will have your Google Analytics data stored in three separate tables.
- raw_hits
- processed_hits
- processed_sessions
Depending on the type of query you want to run, choose the right table. Keep in mind that some of the information (bounce rate, geo-location etc.) isn’t available before hits are processed into sessions.
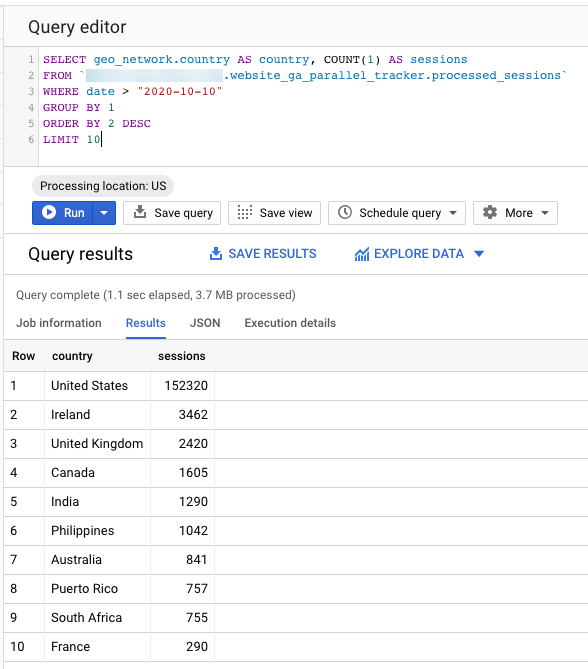
For example, we could write a simple SQL query like this and see the top 10 countries by the number of Google Analytics sessions.
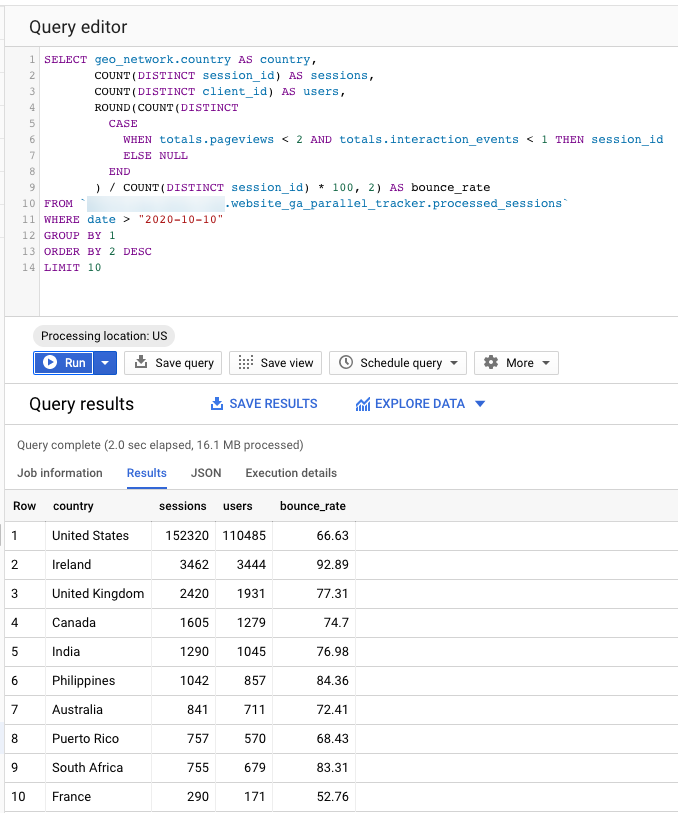
Now, to make this query a bit more interesting, we might add in metrics like users and bounce rate. All doable with SQL, of course.
Notice how you can define your own rules for things like “bounce” and “bounce rate”.
Pretty neat, right?
Using the BigQuery UI is good for testing your setup and quick ad-hoc queries. In most cases, though, you’ll probably use some sort of a BI tool. One of the popular options these days is Google Data Studio. So, let’s use this in our examples a well.
Google Data Studio is free and probably the easiest to get started with. That being said, it is still packed with useful features and makes creating interactive dashboards a fun and enjoyable process.
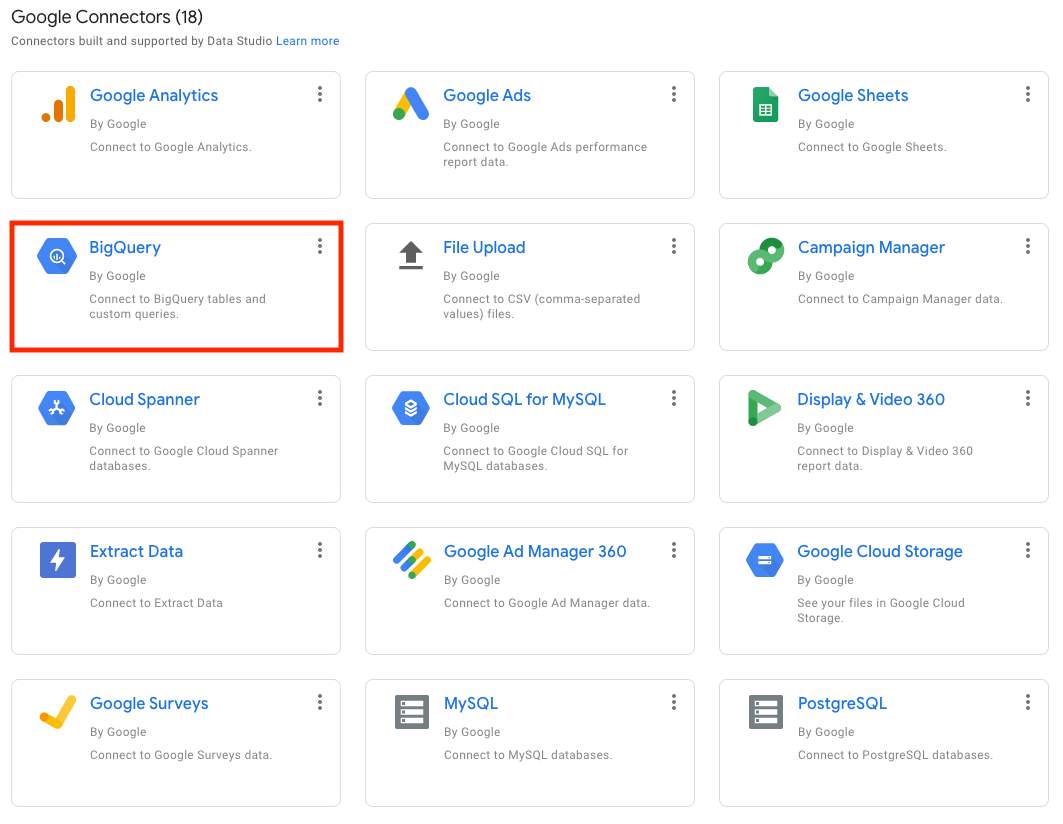
Connecting BigQuery with Google Data Studio
Google Data Studio, like many other BI tools, has a native integration for BigQuery as a data source.
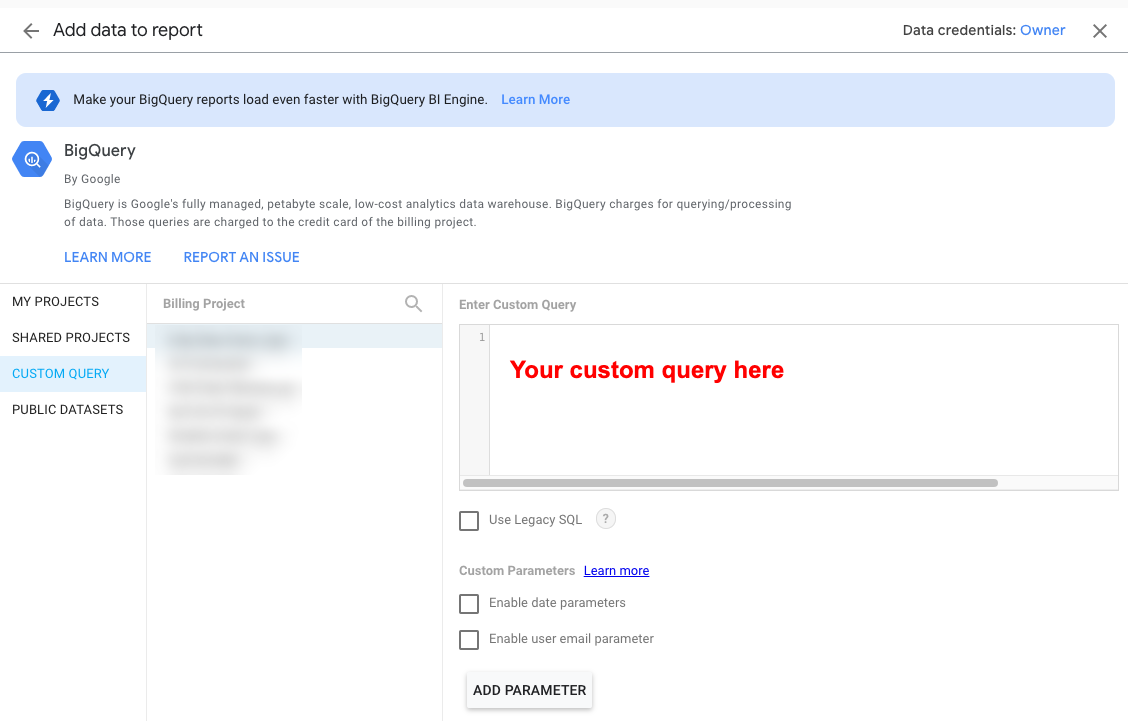
While you can automatically pull all data in a certain table, in most cases it’s a better idea to use a custom SQL query.
Data Studio has this feature built-in as well.
In our example, we’re going to analyze the results of an A/B test run using VWO. We’re using VWO’s custom-event-based integration to send experiment data into Google Analytics.
It’s always a good idea to try your query in the BigQuery’s query editor before implementing it in Data Studio.
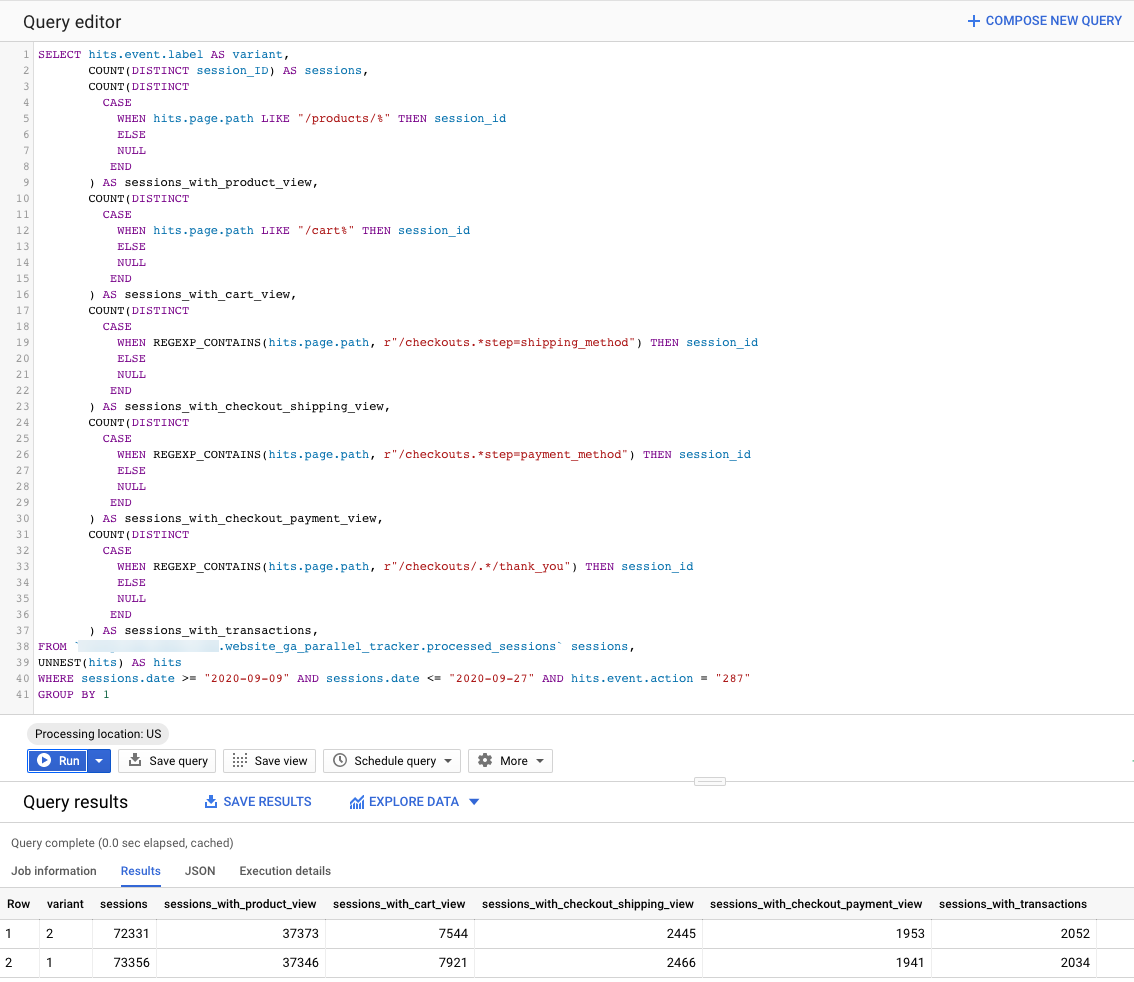
Once we’re happy with the query and the results it returned, it’s time to put the query in Data Studio.
In Data Studio, we can start building all sorts of cool visualizations. For example this one for visualizing the funnels for Control and Variant 1 of our A/B test.
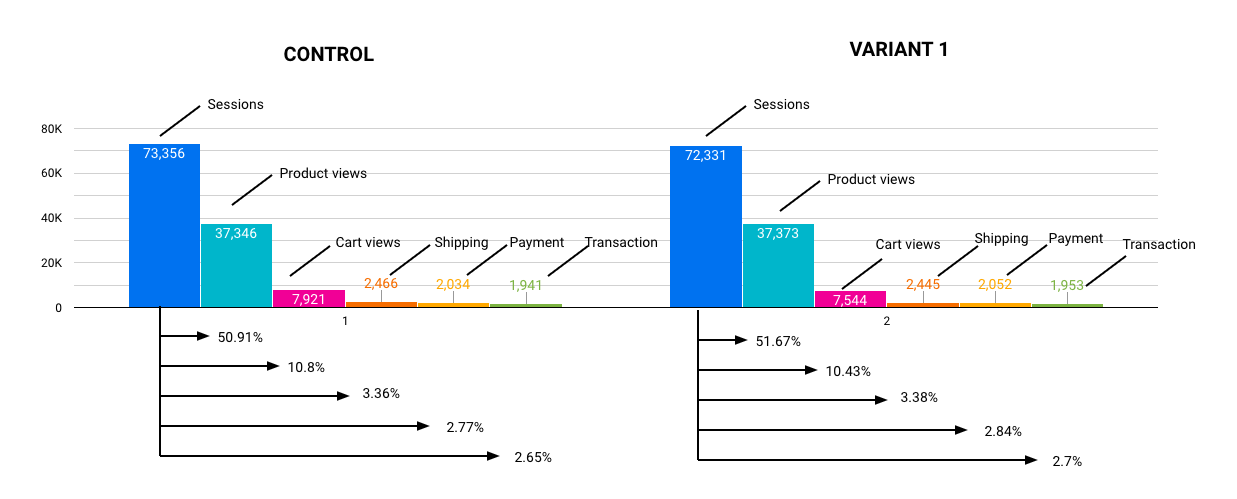
Data Studio is really flexible when it comes to building custom reports, interactive dashboards and quick visualizations. If you can’t find the right chart from the default chart types, check out the community visualizations or go ahead and build one yourself.
Conclusion
Working with your Google Analytics data using SQL opens up a whole new world of analysis opportunities for your digital analytics data. You no longer have to use the metrics and concepts defined and pre-calculated by Google. Feel free to come up with your own rules for things like calculating bounce rate or defining a session.
To get started, you first need to transfer your Google Analytics data into a data warehouse that supports SQL queries. For example, Google BigQuery. There are a few ways you can send Google Analytics data into BigQuery, our recommended method is Parallel Tracking. This will provide you with the most complete dataset, delivered in near-real-time and for a fraction of the cost of GA 360.
Once you have data in your database or data warehouse, you can start writing ad-hoc SQL queries right away. To take your productivity to a next level, we recommend running your queries and reports through a BI platform (i.e. Data Studio).
If you have any questions about analyzing your Google Analytics data using SQL or sending data into a data warehouse, feel free to ask them in the comments below.
I appreciate your wp theme, where did you get a hold of it from?
Thanks. It’s a custom build from scratch.
Love the examples!
Exporting GA data using tools like Supermetrics and Google Sheets has been a pain in the a** to be honest. Really looking forward to using this solution in my work. Thanks!
P
Hi Peter,
How do we get the multi dimensional data using metrics and dimension through sql? For eg: if we have pagepath as a dimension. For which, I can get users as a metric count for a particular date. If I want to split this count to multiple date I. E, dimension. If there is any possible way
Hi Atanu,
This is indeed possible! It all comes down to your SQL skill really.
In general, dimensions will be in “GROUP BY” and metrics will be aggregated by some functions like “COUNT()” or “SUM()”. I hope this makes sense.