
BigQuery is an extremely powerful tool for analyzing massive sets of data. It’s serverless, highly scalable and integrates seamlessly with most popular BI and data visualization tools like Data Studio, Tableau and Looker.
Working with Google Analytics data in BigQuery has mostly been a privilege of those having a 360 version of Google Analytics. Its hefty price tag, though, has made that list quite short.
With Google Analytics Parallel Tracking Service from Reflective Data, having access to Google Analytics data in BigQuery has become a lot more affordable. (you can get a quote from the previous link)
Now, regardless of whether you have Google Analytics 360, a Parallel Tracking system from Reflective Data or some other integration in place, the structure of the data in BigQuery is quite similar.
In this article, I’m giving you a tour of the features in BigQuery and some of the ways how you can leverage them when working with your Google Analytics data.
Take a look at this article if you want to learn more about sending your Google Analytics data into BigQuery first.
In case you don’t have access to any BigQuery dataset containing Google Analytics data, you can check out the Google Analytics sample dataset for BigQuery. The sample dataset provides an obfuscated Google Analytics 360 dataset that can be accessed via BigQuery. It’s a great way to look at business data and experiment and learn the benefits of analyzing Google Analytics 360 data in BigQuery.
In this blog post, though, we are going to work with the demo dataset generated by Reflective Data’s Parallel Tracking System. As mentioned before, the structure of the data is pretty much the same.
Creating and running your first query
With Reflective Data’s Parallel Tracking System, you will have three main tables in your BigQuery dataset. Let’s take a quick look at each one of them with a simple query.
Table: raw_hits
This is the most up to date table and contains raw data coming in from the website, app or via the measurement protocol. Data is available withing ~5 seconds after it was sent.
raw_hits table contains only four columns.
ua– the user agent string of the clientip– the ip address of the clientq– the actual Google Analytics hit payloadtimestamp– when data hit the processing engine (~50ms after it was sent)
For example, we could query the number of hits for every hour in a given day.
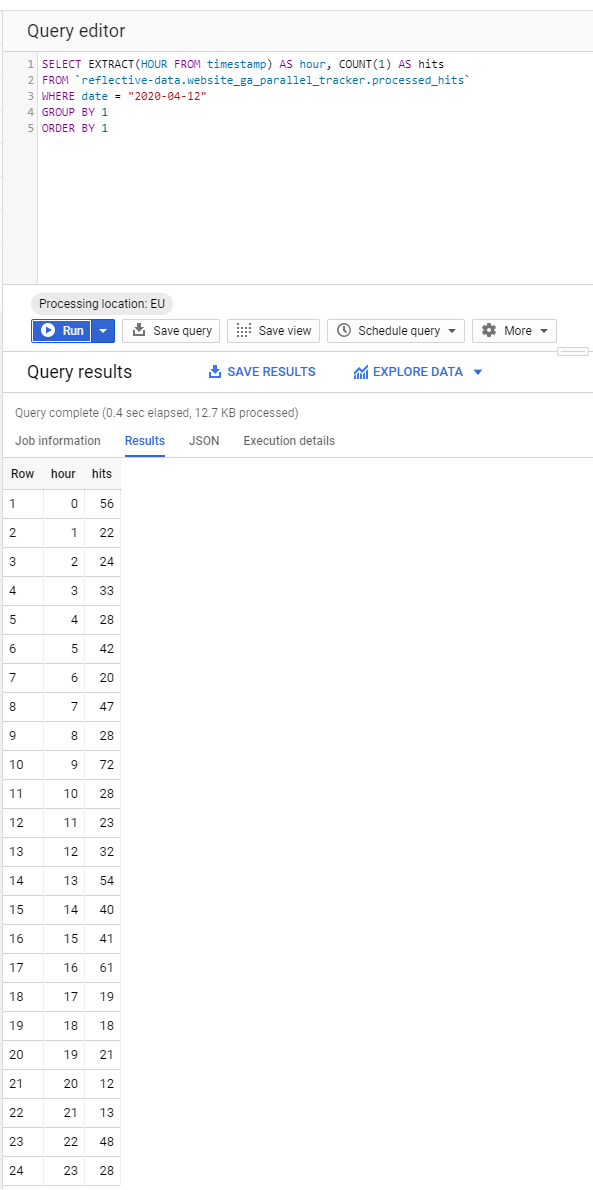
Table: processed_hits
This is a processed version of the raw_hits table. Data in this table becomes available ~30 seconds after the hit was sent. This is still really-really fast and considered near-real-time data.
When it comes to columns, this table is much richer compared to the raw_hits table. It has all the time-related columns (date, hour, minute, timestamp etc.) converted into the correct timezone. Some of the data is in a special format known as a record in BigQuery. This includes columns like traffic_source, page, event, device, transaction etc. In fact, this table has a column for every parameter you can send with a Google Analytics hit. Added are some data points normally not available in Google Analytics (ip address, user agent, client ID, user ID etc.)
List of paramaters/columns as seen in Measurement Protocol Reference.
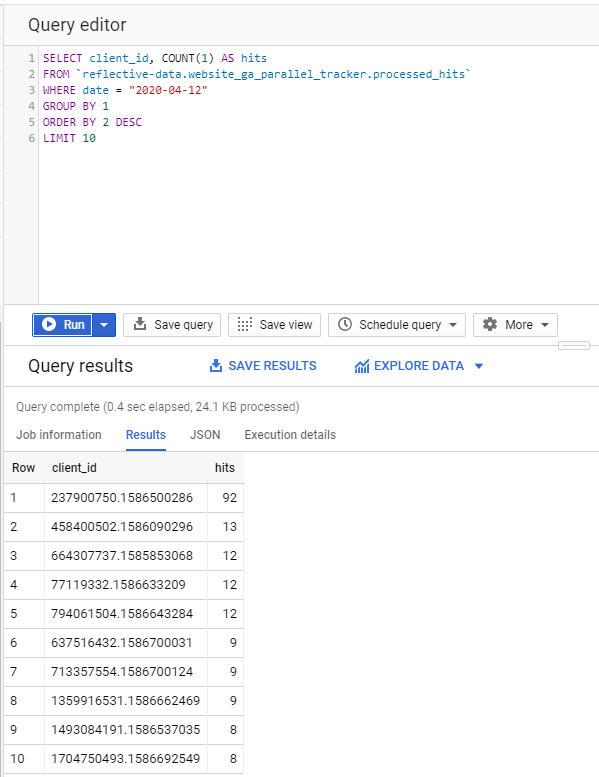
As an example, we are querying top 10 visitors (by client ID) that created the most hits in a given day.
Isn’t that easy? and cool, too!
I certainly like working with my Google Analytics data using SQL queries. Okay, let’s move on.
Table: processed_sessions
This table is, for sure, the richest of the three. It has all the columns from processed_rows but also includes quite a few new ones. These are the columns that require more processing (ip address to geolocation etc.) and/or the session to be ended (total hits in a session etc.). For these reasons, this table is usually updated a few times a day and a final version is generated at the beginning of the next day.
If you aren’t completely sure how a web session is defined in Google Analytics, take a look at this article.
A good thing about raw data is that whether you like the fact that Google Analytics is mostly session-based or not, you have the freedom to calculate your metrics however you wish. You could also mix and match different techniques.
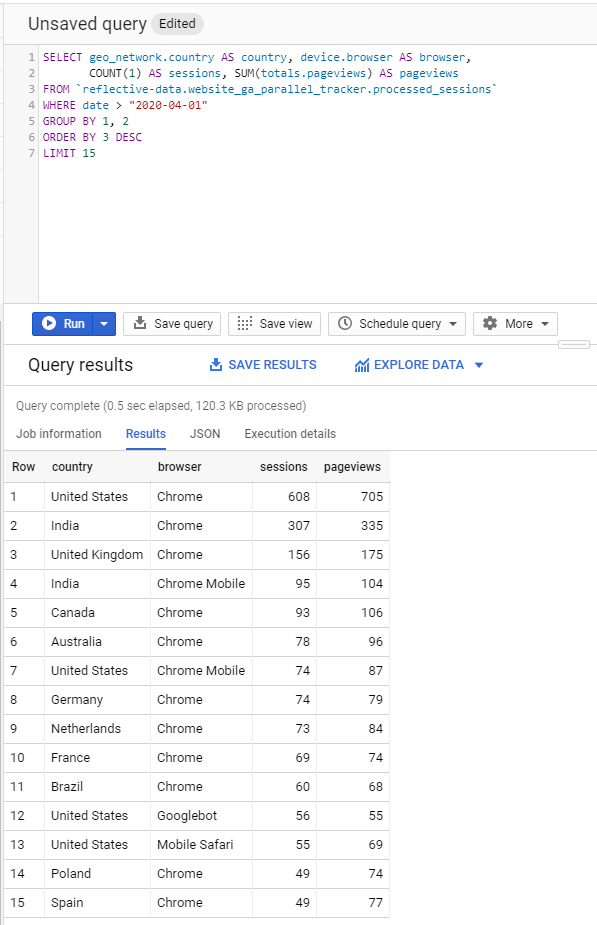
For example, we might query top country/browser combinations by the number of sessions and pageviews in a given month. Let’s see how that would look like with our demo dataset.
Creating and running more complex queries
The best thing about raw hit-level data is that you’re not limited by things like sampling or pre-defined metric/dimension combinations. Both of which are common in Google Analytics, both the UI and the Reporting API.
What’s more, with BigQuery you can load in data from almost anywhere and mix it with your analytics data in any way you like. This may include data from your CRM, CMS, Ads platform or other analytics tools.
Google Analytics’ data model is structured so that session-based dimensions (like source/medium) don’t play well when combined with user-level or page-level dimensions and metrics. And there’s a limit to the number of dimensions we can see side-by-side: two dimensions is usually our limit in the interface, five in custom reports, and the API allows for seven dimensions. With BigQuery, there are no such limitations.
For example – ecommerce customers may have trouble pulling exact stats of the number of users from Social Media that saw a product page and then subsequently purchased the same product. BigQuery users can handle that with a single query.
By Alex Moore, source
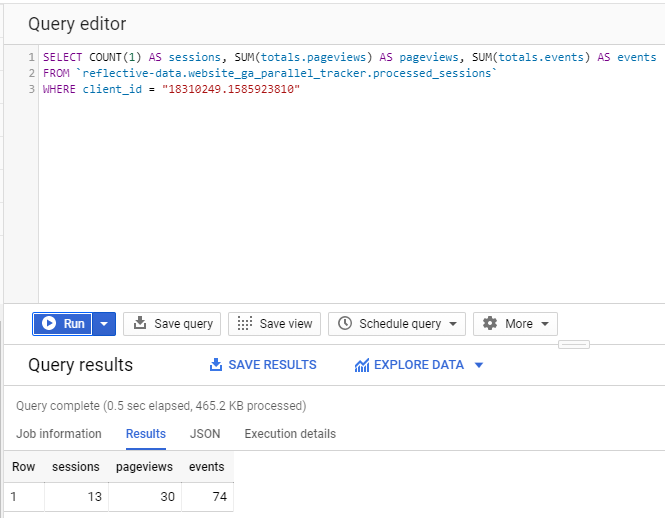
One of the queries that almost always ends up being inaccurate (due to sampling) in Google Analytics is when you want to analyze all hits triggered by a single user. With BigQuery, this query is fast and simple, and there is no sampling. Never.
First, let’s go ahead and query some totals.
Now, let’s take a look at all of the hits in chronological order. This will give us a detailed overview of their user journey.
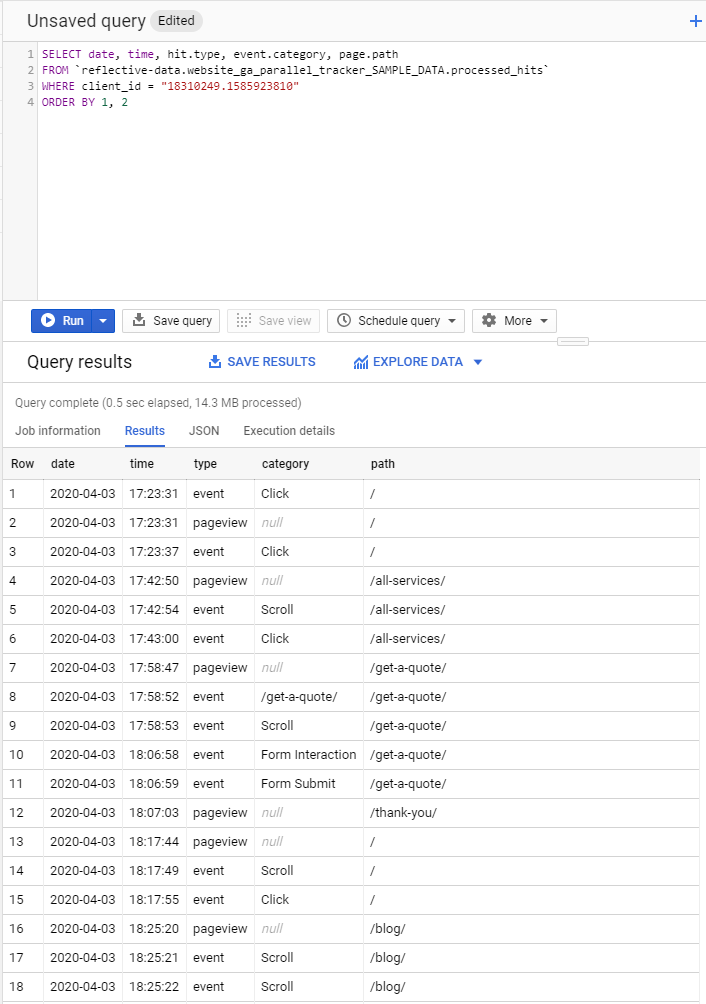
I believe you can see how analyzing a user journey like this can be very useful. For example, when a new lead comes in, before contacting them you could check what content they’ve already interacted with.
***
For someone that has worked mostly with the Google Analytics UI and not with the raw data before, there are some things that can be a bit confusing in the beginning. For example, not all of your common metrics are available as a column in BigQuery. Even the really basic ones, like bounce rate. That means you have to define them in your query.
Let’s take a look at the bounce rate for the top 10 landing pages in our sample dataset.
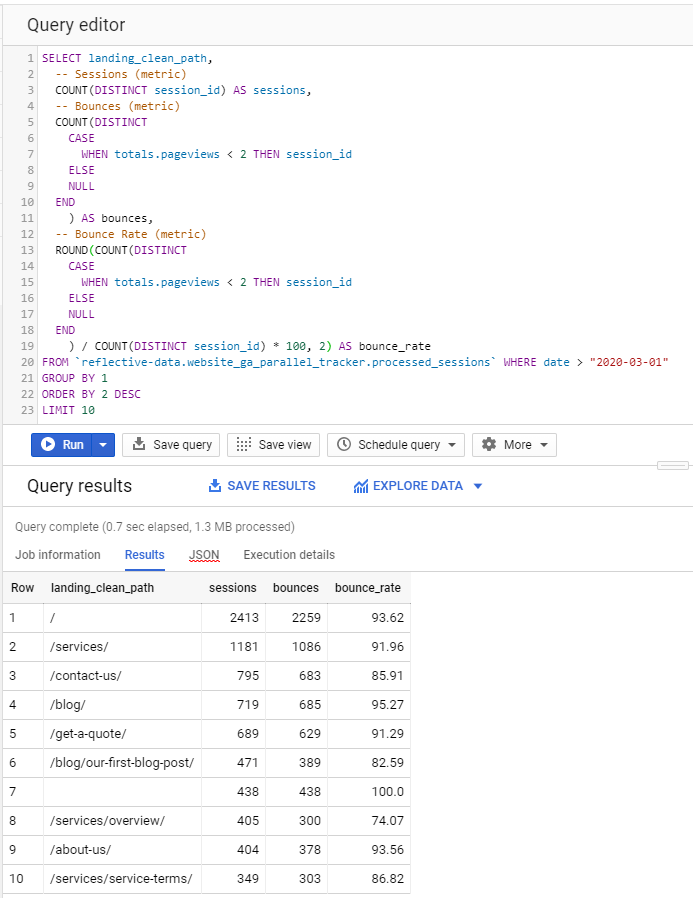
Calculating your own metrics like this can be a bit frustrating in the beginning but you actually only have to write most queries once and can later save them as views or saved queries in BigQuery. A benefit of defining your own metrics is that you are not limited by pre-defined metrics in Google Analytics. As you can see, in the query above we defined bounce as a session that has less than 2 pageviews but we could also include a rule that there can’t be any interaction hits in the session. We could also play with session duration or other data available in BigQuery.
A true value of having your analytics data in BigQuery, though, is that you can easily join it with other data that you’ve also sent to BigQuery.
For example, you could use Google Ads Data Transfer tool for BigQuery to automatically send all of your Google Ads data into a BigQuery dataset. This is especially useful if you’re using Google Ads auto-tagging solution because that means the only connection between your Google Analytics and Ads data is the gclid ID which is unique for every click.
With a simple query, you can join your processed_sessions table with ClickStats table.
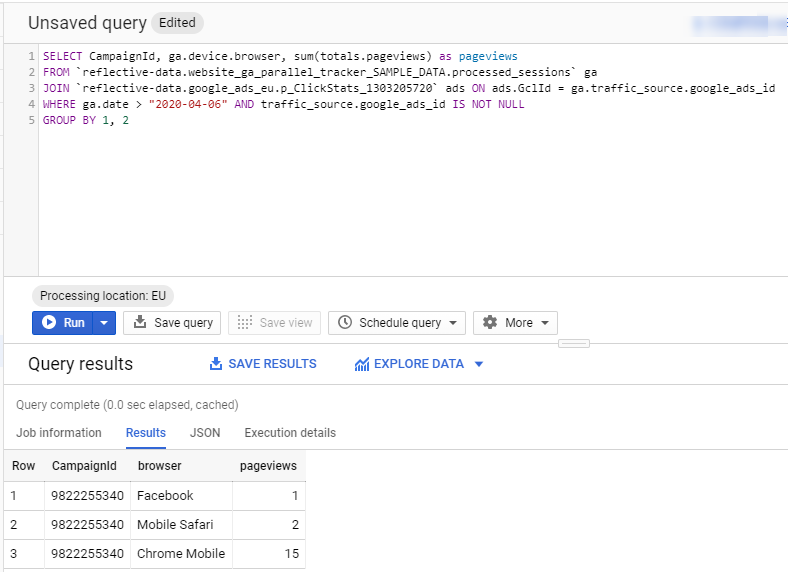
After joining two datasets, you can combine any data points that are available in either dataset. The most important one, perhaps, is the cost data from the Ads dataset. This would allow you to calculate the amount of money you spent on acquiring each user.
Analyzing BigQuery data in a BI tool
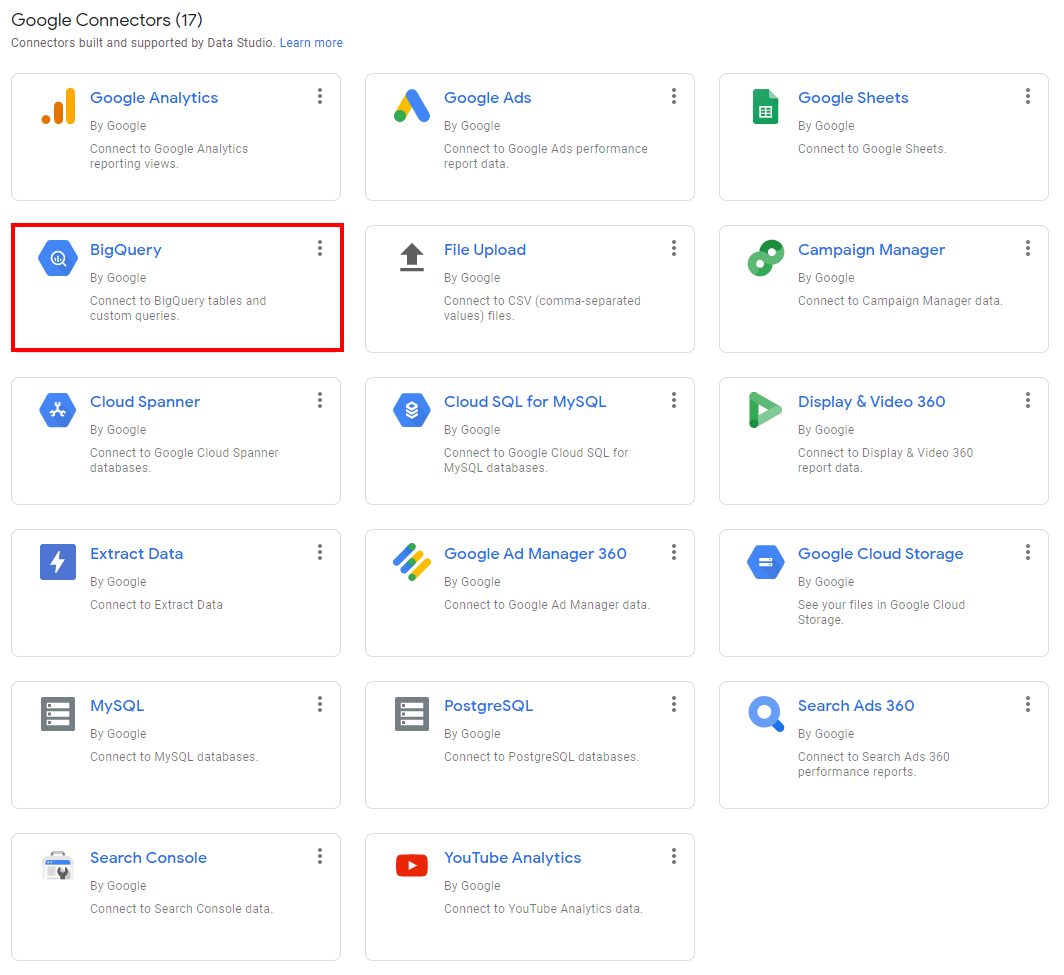
Not everyone can write complex SQL queries to access their analytics data in BigQuery. Luckily, BigQuery has a native connector with almost all of the major BI and data visualization platforms.
My default recommendation is Data Studio. It’s free, full of powerful features and since it’s also from Google, you get a smart caching layer between Data Studio and BigQuery which can significantly lower your BigQuery costs.
Connecting BigQuery and Data Studio is really simple. All you have to do is create a new source in Data Studio and select BigQuery. It will automatically show you the list of Google Cloud projects you have access to and from there you can easily navigate to your datasets and tables.
Once you found the correct table, you can either choose the fields you want to include in your report (if not sure, choose all) or write your own query.
In our example, we connected two tables (processed_hits and processed_sessions) and selected all fields available in these tables.
Now, let’s create a quick time-series chart to see the number of hits of each hit type per day in our selected time period. Settings for a chart like this are really simple.

And this is how the chart itself looks like. Nothing special but allows you to have a quick overview of your traffic and spot any anomalies in tracking.

Another useful chart I recommend setting up is a time-series comparison between data in Google Analytics and BigQuery. This means you have to blend two data sources.

As you can see, the numbers are pretty close.
For more advanced dashboards you might want to write a custom query on a Data Studio data source level. This way you can pre-join different tables and/or datasets.
***
While being more difficult than using the Google Analytics UI, the freedom you get from having access to raw hit-level data in BigQuery is definitely worth it. As mentioned at the beginning of this article, you don’t necessarily have to spend a fortune on Google Analytics 360 because with Reflective Data’s Google Analytics Parallel Tracking System you can send your analytics data into BigQuery for a fraction of the money.
Should you have any questions about working with Google Analytics data in BigQuery, post them in the comments below and someone from our team will get back to you.
If you want to learn more about the Parallel Tracking System, click here.
Thanks for sharing. I read many of your blog posts, cool, your blog is very good.
Hi Jason,
I would also appreciate your response to Vishwjeets’ question?
Thanks
Hi Jason
Is the client_id column used in one of the queries above available in the table by default or you have added that as a Custom Dimension? IN the sessions table it is named as clientId which is creating a confusion.
I see that sessions table also has clientId available but as I don’t have GA360 I can onnly use the public GA sample data set available in Big Query. Is there a public dataset available in which I can see other tables available in GA.