At Reflective Data, we are all advocates for data-driven business. Not only does it make things easier and more logical, being data-driven in your business decisions will also save you time and make tons of more money!
Being data-driven begins with data, more specifically with collecting data. Having a lot of data is good and all, but without having what it takes to really understand what’s in there, it is pretty much useless for your business.
To really make use of all the data that you are collecting you need to make it tell you something, and as it usually is in the business – the sooner the better.
This is where the dashboards come into play.
Dashboards are in many ways the best option for exploring and understanding the information that’s hidden in the thousands or millions of data points collected over time. That is, considering the dashboard made the way it should be, not some random plug-and-play thingy.
Custom built business dashboards have so many advantages, here are a few to give you an example.
- Dashboards can combine various data sources and types
- Graphs and diagrams will give you a quick overview of what’s happening
- Time-range graphs help you detect trends and bigger changes
- Better dashboards are interactive, letting you filter data by any given dimension
Now, let’s take a look at some of the dashboards every business should have.
General Business Dashboard
Also known as Executive Reporting Dashboard. Here’s a nice example built on Klipfolio.

An executive reporting dashboard is a central monitoring tool for a company’s real-time performance data tailored to the needs of executives.
- Most important KPIs from various departments
- Reliable helper in decision-making process
- Enables general performance monitoring with ease
Such dashboard is essential for every manager but could be insightful for various departments over the company. If your company doesn’t have one, consider getting one ASAP!
Managers that are using these general dashboards built by Reflective Data have told us that they’re using them for making most of their business decisions.
Social Media Dashboard
Social media is a great medium for both finding new customers and keeping in touch with existing ones. It also generates a lot of data, a dashboard will help you cover it all with ease.
- Monitor all the major KPI-s, in all platforms
- Analyze demographic data and get to know your audience like never before

Being active on social media takes time and effort. With this kind of dashboard, you will know exactly which effort is paying off and which not so much.
Based on insights from this dashboard, you can plan your future strategy on social media more accurately and effectively.
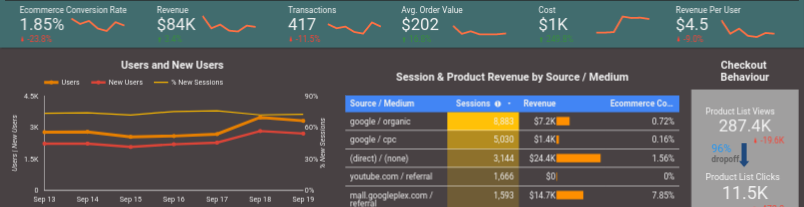
Advanced E-Commerce Dashboard
Running an e-commerce business? This is a dashboard you absolutely must have!
Combining data from various sources this report will show exactly what’s going on with your e-commerce store.
- Which traffic is generating the most revenue
- What might hold your visitors from converting
- Combine and compare multiple data sources

AdWords Performance Dashboard
You are paying for ads. It is super important to see exactly where your money goes and what you get for it.
Here’s to give you an example of what kind of questions an AdWords dashboard would help you answer.
- How are your keywords performing on AdWords?
- Where should you invest more/less?
- How does your paid traffic differ from organic and social media traffic?
Based on feedback we’ve gathered, the AdWords dashboards we have built have saved our clients thousands of dollars every month.

Need help building your next dashboard?
Reflective Data has the experts needed for building all sorts of business dashboards. Here’s a step-by-step overview of the process.
1. Working with the analyst
Our analyst will work closely with your team to make sure what kind of dashboard(s) you need.
What data should be in there and what should be excluded, how to visualize it all etc.
2. Getting the design ready
In this step, our analyst will work with one of our professional designers to put it all in a nice and easy to consume format.
We can also make the dashboard to match your brand guidelines.
3. Making the dashboard come to life
In the final step, our developers combine information from the analyst and designer to make a solid product that will please both you and your team.
Our developers have worked with all sorts of charting libraries and API endpoints.
Over the past 3 years, we have built more than 250 custom dashboards for both startups and large enterprises.
Learn more or contact us today.
Thank you for reading this article, you are more than welcome to share your thoughts down in the comments. Here are some ideas to get you started.
- What business dashboards does your company already have?
- Which tools/platforms you recommend for building custom dashboards?
Ah, thanks for reminding me. We totally need a dashboard for AdWords, using just GA doesn’t cut it anymore.