There is a wide variety of Javascript data visualization (charting) libraries available for free. One problem this (good) situation has caused is that it can be rather difficult to pick the right one for your project. And, trust me, switching the library after it has grown to be part of your project is a real pain in the butt.
Therefore, based on my own experience, I will do my best to make the choosing process a bit easier for you. Here’s a list of criteria which I based my suggestions on.
- Number of different charts available
- Flexibility, configurations
- Default styling
- Ease of implementation and use
- Popularity, community
- Free & open source
Bookmark
Feel free to bookmark this page as a useful resource.This is an ever-changing topic and we intend to update it as information changes.
Projects are very different, in this article we are referring to our experiences building data analytics platform (Reflective Data user behavior analysis dashboard) but most of the thoughts are applicable everywhere.
While YOU have to find the right library for your project, my top is here – first being my favourite for most projects.
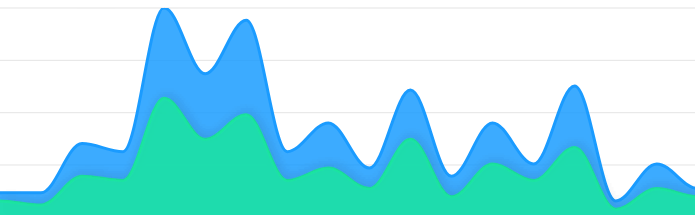
Apex Charts

Apex Charts is definitely the newest and least known libraries in this list. And even though it doesn’t have a very large community yet, its beautiful out-of-the-box design and easy setup definitely make up for it.
For several projects, Apex has been our go-to charting library. Definitely worth giving it a try.
Pros
- Beautiful design
- Easy to setup
- Open source
Cons
- Smaller community
- Fewer options than in some larger libraries
Chart.js
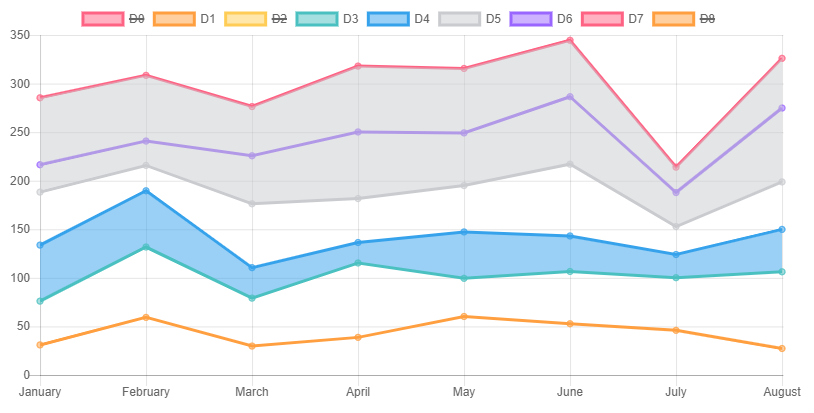
Chart.js is one good-looking Javascript charting library that is flexible and easy to use. It used to be our go-to library for many projects before switching to Apex Charts, mostly because of the looks and a few extra features.
Pros
- Looks good out-of-the-box
- Open source
- Easy to setup
- Good community
Cons
- Fewer options than in some larger libraries
Google Charts

Google Charts is a good option if open source is not a must. It is especially good if you are making a tool that should look familiar to Google Products’ (Google Analytics, Data Studio etc.) to users .
Pros
- Nice Material theme
- A lot of options
- Large options
Cons
- Free but not open source
- Can be slower than others
ECharts

ECharts is a powerful Javascript charting library that can meet the needs of a more advanced user. While it’s an overkill for most simpler visualizations, it is definitely worth checking it out to see all of its great features.
The very first version of Reflective Data platform used ECharts as its core charting library.
Pros
- Lots of different charts
- Many options
- Active community
- Open sourced under Apache License
Cons
- Some materials are Chinese only
- Too big for basic projects
Bookmark
Feel free to bookmark this page as a useful resource.This is an ever-changing topic and we intend to update it as information changes.
Conclusion
No other person can say what is the right solution for your project. The best thing I can recommend is to pick your top three and then build a quick MVP with each of them. This way you can see which one you like the best both in terms of looks and development.
At Reflective Data, we continue using Apex Charts for most of our projects. This said, we still have 5-6 different libraries currently in production, including some paid ones.
Feel free to share your thoughts in the comments below.
One thought on “Top Javascript Charting Libraries”