Platforms like Hootsuite and Google Analytics are valuable tools for tracking marketing data. With the insights you gain through Marketo, Ahrefs and similar services, you can feel confident in your decision-making and self-assured in your strategies. These solutions are efficient and effective … most of the time.
As you’ve likely heard before, a tool is only as good as the hand that wields it. If you’re unaware of the full range of capabilities and features your platform provides, you’re falling short of its full potential. More than that, you’re prone to errors that could compromise your marketing performance.
With this in mind, what are some of the most common analytical mistakes marketing professionals make? It’s wise to understand the pitfalls of analytics platforms, so you can avoid them with ease.
1. Choosing Favorite Tools
While some tools are more effective than others, you’ll never find a one-size-fits-all solution. No algorithm applies to every situation, and no data source provides all the information you need. You might prioritize certain features of your platforms over others, but it’s crucial to experiment and explore.
Some of the features you’ve overlooked might have incredible potential, but you won’t know until you’ve examined them. When marketing professionals play favorites with tools, they waste money and increase turnaround time. You’ll avoid these common mistakes as long as you keep an open mind.
When you’re developing your marketing strategy, try both new and old things, searching for solutions that are appropriate for your set of circumstances. These circumstances will change, and you have to evolve with them by adapting your approach. Dependence on any one tool is counterintuitive.
2. Picking the Wrong Graphs
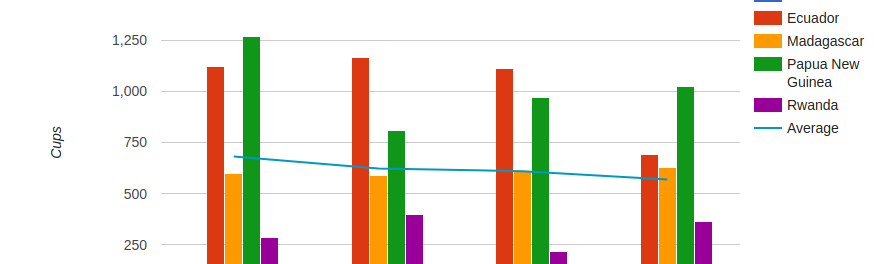
You want to communicate your results to your team through data visualization, but it isn’t such a simple task. You might confuse them if you choose the wrong type of chart or graph, leaving them with more questions than answers. You have to represent different kinds of information in different ways.
As an example, line and bar graphs are best for showing progress over a period of time. Pie graphs are ideal for displaying the number of people in your customer base who come from various geographies. When deciding on data visualization, ask yourself what you want to achieve with a chart or graph.
When you look at data visualization within the context of your marketing goals, you’ll have a better understanding of what information is important and how to show it. Start with your initial intention for the data to sidestep some of the mistakes others in your position have made in the past.
3. Starting With Metrics
While many companies use platforms for collecting, storing and analyzing data, not all of them follow a coherent plan. In truth, it isn’t enough to have access to information. Once you obtain the data, you need to approach it with a clear and agreed-upon goal that your team understands.
It’s one of the mistakes startups often make with data, failing to set strategic priorities early in the process. You integrate something new into your website — like a favoriting feature — but you haven’t defined your goal. Without that goal, you don’t know what success looks like, or whether you’ve achieved it.
Amanda Richardson, chief strategy officer for the travel company HotelTonight, poses the important question: “…what’s the key metric that’s going to determine success?” Richardson goes on to explain: “Without that clarity, you end up with a situation where one person is saying, ‘That was great for our most popular users, who favorite an average of 12 hotels’ and another is saying ‘But this was intended for new users.’ And you’re thinking, ‘Was it?'”
Improve Your Marketing Strategy
A tool is only as good as the hand that wields it, and now you know how to use yours a little better. As long as you avoid these three mistakes, you’ll make the most of the platforms you employ every day and improve your marketing strategy.
Good post Kayla!
I’m always struggling to find the correct charts. Would love to read some books on this topic. Any suggestions?
M