Every analyst, manager, and CEO likes awesome charts. A good chart is nice to look at, easy to understand, and creating one shouldn’t be a rocket science.
There are hundreds of great tools and frameworks that allow you to create beautiful charts. Having tried tens of them, I finally chose Google Charts as my go-to tool.
At reflective Data, we are obsessed about good data visualization! And whilst we are heavy users of D3.js and other advanced solutions, we also use other easy to implement yet nice to look at tools. Google Charts being one of them, one of the best ones actually.
Beginners
For very basic users, I suggest looking into some of the WP plugins. Just google “WordPress chart plugins”. They will do the job, but Google Charts has much more capabilities for a little more effort.Here’s why
There are chart creating tools that would outperform Google Charts in some specific criteria, but combining all of them, GC is a clear winner.
- They look good and familiar (Google, you know)
- They work well with Google related data (Google Analytics, Docs, AdWords …)
- Good documentation & started is easy
- Great options for customisation
- It’s free!
Using Google Charts in a WordPress Post
Google Charts are flexible, you can put them everywhere (on the internet) and one of the places you’d like to use them might be your blog. And if your blog happens to run on WordPress, here’s what you need to know.
Pretty much same applies for all websites.
Step 1 – Load the script
There are multiple ways for loading scripts in WordPress, I am covering the two most common ones.
I recommend adding the script for Google Charts in the
<head>as opposed to<body>or<footer>.
Option 1. Put it straight in the <head> tag in your WordPress theme files. Normally header.php
<script type="text/javascript" src="https://www.gstatic.com/charts/loader.js"></script>
Option 2. Load the script using wp_enqueue_script
wp_enqueue_script( 'google-charts', get_template_directory_uri() . '/js/google-charts.js', array(), '20151215', false );
Step 2 – Take a look at the Chart Gallery
They have a super nice gallery showing what can be done using Google Charts, including the source code and even a link to JS Fiddle so you could play around on your own.
That’s it, pick the chart you like and drop the code into a WordPress post (text mode).
Examples of Google Charts in a WordPress post
Sample 1 – Line Chart
Code:
<div id="chart_div"></div>
<script>
google.charts.load('current', {packages: ['corechart', 'line']});
google.charts.setOnLoadCallback(drawBasic);
function drawBasic() {
      var data = new google.visualization.DataTable();
      data.addColumn('number', 'X');
      data.addColumn('number', 'Users');
      data.addRows([
        [0, 0],   [1, 10],  [2, 23],  [3, 17],  [4, 18],  [5, 9],
        [6, 11],  [7, 27],  [8, 33],  [9, 40],  [10, 32], [11, 35],
        [12, 30], [13, 40], [14, 42], [15, 47], [16, 44], [17, 48],
        [18, 52], [19, 54], [20, 42], [21, 55], [22, 56], [23, 57],
        [24, 60], [25, 50], [26, 52], [27, 51], [28, 49], [29, 53],
        [30, 55], [31, 60], [32, 61], [33, 59], [34, 62], [35, 65],
        [36, 62], [37, 58], [38, 55], [39, 61], [40, 64], [41, 65],
        [42, 63], [43, 66], [44, 67], [45, 69], [46, 69], [47, 70],
        [48, 72], [49, 68], [50, 66], [51, 65], [52, 67], [53, 70],
        [54, 71], [55, 72], [56, 73], [57, 75], [58, 70], [59, 68],
        [60, 64], [61, 60], [62, 65], [63, 67], [64, 68], [65, 69],
        [66, 70], [67, 72], [68, 75], [69, 80]
      ]);
      var options = {
        hAxis: {
          title: 'Time'
        },
        vAxis: {
          title: 'Count'
        }
      };
      var chart = new google.visualization.LineChart(document.getElementById('chart_div'));
      chart.draw(data, options);
    }
</script>
Sample 2 – Pie Chart
Code:
<div id="piechart"></div>
<script>
      google.charts.load('current', {'packages':['corechart']});
      google.charts.setOnLoadCallback(drawChart);

      function drawChart() {

        var data = google.visualization.arrayToDataTable([
          ['Task', 'Hours per Day'],
          ['Work',     11],
          ['Eat',      2],
          ['Commute',  2],
          ['Watch TV', 2],
          ['Sleep',    7]
        ]);

        var options = {
          title: 'My Daily Activities'
        };

        var chart = new google.visualization.PieChart(document.getElementById('piechart'));

        chart.draw(data, options);
      }
</script>
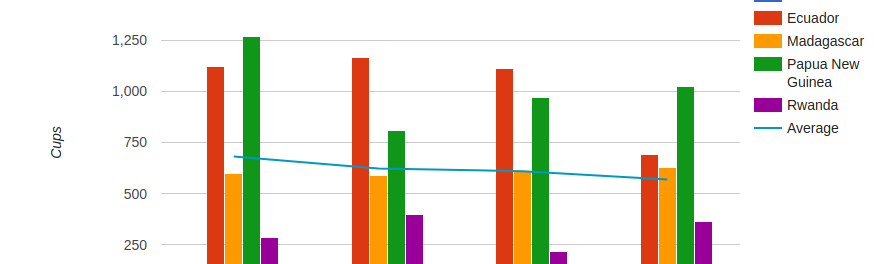
Sample 3 – Combo Chart
Code:
<div id="combo_chart" style="width: 700px; height: 500px;"></div>
<script>
      google.charts.load('current', {'packages':['corechart']});
      google.charts.setOnLoadCallback(drawVisualization);
      function drawVisualization() {
        // Some raw data (not necessarily accurate)
        var data = google.visualization.arrayToDataTable([
         ['Month', 'Bolivia', 'Ecuador', 'Madagascar', 'Papua New Guinea', 'Rwanda', 'Average'],
         ['2005/06',  135,      1120,        599,             1268,          288,      682],
         ['2006/07',  157,      1167,        587,             807,           397,      623],
         ['2007/08',  139,      1110,        615,             968,           215,      609.4],
         ['2008/09',  136,      691,         629,             1026,          366,      569.6]
      ]);
    var options = {
      title : 'Monthly Coffee Production by Country',
      vAxis: {title: 'Cups'},
      hAxis: {title: 'Month'},
      seriesType: 'bars',
      series: {5: {type: 'line'}}
    };
    var chart = new google.visualization.ComboChart(document.getElementById('combo_chart'));
    chart.draw(data, options);
  }
</script>
Why not just use images of charts?
Of course, you could also use some tools that will enable you to create charts as image files that you can later upload to WordPress. Let me tell you why you should consider not to.
- That’s an extra step. You’d still have to insert all the data in there like you do with the Google Charts.
- It’s super easy to update data straight in your post.
- It’s interactive, just move your mouse over the examples above.
Just give it a try and you will see the difference!
Isn’t putting the code in the post a bad idea?
If you are a heavy user of those graphs, I would recommend building a plugin or at least a shortcode for them. But if you only use a few charts once in a while in your posts there’s nothing bad about inserting them in plain code straight into your post.
Should you have any questions about the setup, just ask them in the comments below and we’ll get them answered!
Conclusion
If you are looking for an easy-to-implement charting library that is also nice to look at and has a ton of customization options, I would recommend giving Google Charts a try. Besides everything else, it also has a super nice library and a good community using it.
In case you are looking for a really scalable charting solution with virtually unlimited customization options, look into D3.js.
Get started with Google Charts
Please let us know in the comments which charting library you are using and what are its benefits. Plus if you have any questions about setting up Google Charts, don’t hesitate to ask us.
It is not working for me if I use script code inside post. However If I use the same thing on empty page – hand made, not wordpress page then it Works.
I am trying to make it working ex here: https://pcpraha.cz/herni-pc-pocitace/hunter-vi-herni-pocitac/
Hi there,
Your explanation was so good, however, I cannot solve my problem. The Google charts is available in a page but I am going to use it in my learndash course everything appeared except the chart :(. Do you know how can I resolve that? I did the first step and added the code in header.php of the theme.
How did you make a Google chart resize responsively in your WordPress site?
I recommend you take a look at this example https://codepen.io/flopreynat/pen/BfLkA
Thank you very much for this! This worked. Two questions –
1) Does this method slows the site if I used it most of the blog pages?
2) I am planning to add tables provided by google, Is it a good idea for SEO?
Thanks again.
and the codes above only work on line chart and not on pie chart or tables. What could be the reason?
It works in the examples in this post. So, should be fine.
Hello!
1. It does have some minor effect on the speed of your site, static images will load faster.
2. Again, static HTML tables will load faster and work better in terms of SEO.
It all comes down to your goal, fancy interactive data visualization or performance and SEO.
Wow, that seems easy. I am no coder but probably going to look into it. Still, can someone suggest a plug and play plugin for WP?