While it was originally built for tracking general marketing and ecommerce websites, Google Analytics can be configured to track your SaaS app as well. After building tracking setups for 11 different SaaS tools, I can say that Google Analytics excels in tracking SaaS. In this article, I’m giving you a bunch of practical guidelines for doing the same with your own (or your client’s) SaaS app.
Category: Tools
Depending on the type of website you are working with, it is likely that some percentage of your users are using their browser in incognito or private mode.
Since using incognito mode can skew the numbers you see in analytics, it is really good to know the estimated percentage of visitors that prefer to stay incognito.
Let’s be honest, most companies don’t really think about nomenclature when it comes to setting up their tags, goals or A/B testing experiments. And that creates a horrible mess that will steal your teams valuable time and makes sure no-one really knows what’s going on.
At Reflective Data, when we start working with a new client, we always start by figuring out what their current system consists of — and in many cases, it’s a real headache. Not to mention, when we ask the client about a specific tag or goal that they set up 6 months ago, they don’t remember anything — and the name they chose isn’t helping much either.
Data visualization allows marketers to physically see and communicate with their target audience. Marketers typically have all the same information via text, but turning it into a visual aid can allow companies to make business decisions much faster. Simple aids like pie charts or line graphs can take thousands of pieces of information and compress them all down into something legible.
Creating these visuals on your own can take more time than reading through the slog of information. The good news is that technology has created data visualization tools for marketers to easily pour their data into and create the visuals for them.
Depending on whether you are using the free or 360 version of Google Analytics you get 20 or 200 custom dimensions and metrics to work with.
When used correctly, these custom definitions can be one of the most useful custom features in Google Analytics. They allow you to tailor your analytics to meet your needs and to match your KPI-s.
One of the most common problems related to custom definitions has been that people don’t know what exactly are the dimensions and metrics they should be tracking.
Only Google knows exactly how many websites are using Google Analytics, yet estimates suggest as many as 30-50 million websites use the service.
In this article, I’ll discuss how you can use Google Analytics data safely and what kind of data security and privacy options you can choose within Google Analytics.
Google Analytics, undoubtedly an industry leader in digital analytics, comes with a decent list of features available out of the box. Naturally, every website is different and so are their key objectives.
Tracking the performance of those key objectives is exactly where Google Analytics goals come into play. In this article, we are covering how to track the popular user actions as goals in Google Analytics.
Google Analytics’s visual interface is great for getting a quick overview and basic data exploration. Often times, in order to find useful insights, you need to take a deeper look and the visual interface just don’t cut it anymore.
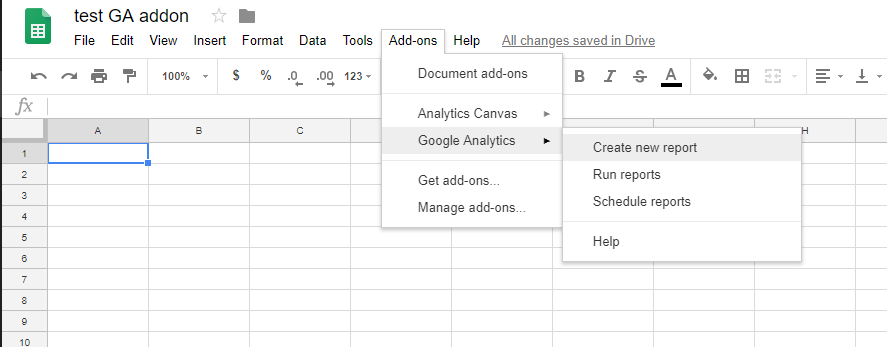
In case you are like me, and many other data-driven marketers/analysts, you like working with spreadsheets. Luckily, pulling your Google Analytics data into Google Spreadsheets is easier than you might think.
If you’ve ever worked with Google Analytics API, you are probably familiar with the Query Explorer. What many users don’t know about is that Google also has a similar tool called Request Composer. The main difference between the two is that while Query Explorer is built on top of Reporting API v3 the Request Composer […]
Apache Superset is a modern, enterprise-ready business intelligence web application that makes it easy to visualise large datasets and build complex dashboards. At Reflective Data, we are using Apache Superset to monitor all data going through our platform with minimum latency. This allows us to easily combine data from different databases and every analyst can […]


