You’ve probably heard of Google Data Studio, a powerful and flexible tool that lets you visualize data from various sources. One of the most popular use cases, in my opinion, has been visualizing data from Google Analytics.
Recently, Google made it even easier to get started with connecting the two, Google Analytics and Data Studio, by giving us three nice-looking yet insightful reports. Even better, you can customize the reports in any way you wish.
Getting started
We expect you already have a Google Analytics account and some data in there. Knowing Data Studio is not needed.
Google Data Studio is an amazing tool and I definitely recommend everyone to play around with sample reports available, try connecting them with your real data and customize them to show the information you care about the most.
Now, to see those three new reports I was talking about you’d have to go to Google Analytics. Pick the right account, property, and view (top left) and click on Customization. Then click on Custom Reports.
There you should be able to see a line that says: “See your audiences, acquisitions and behaviors visualized in a brand new way. Try Google Data Studio now!”. <– you can also click on these links to see the reports.
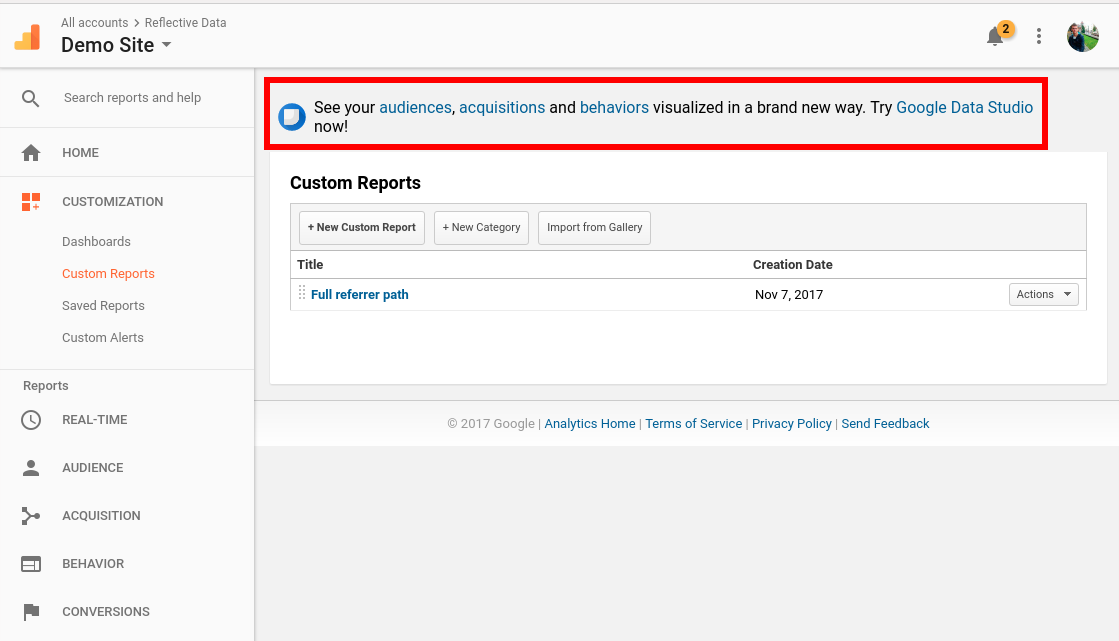
Now, all you have to do is to click on one of these links. Try all of them to see which one is the most useful for you!
I will quickly go through all of these reports and give you an overview of what you’ll find there.
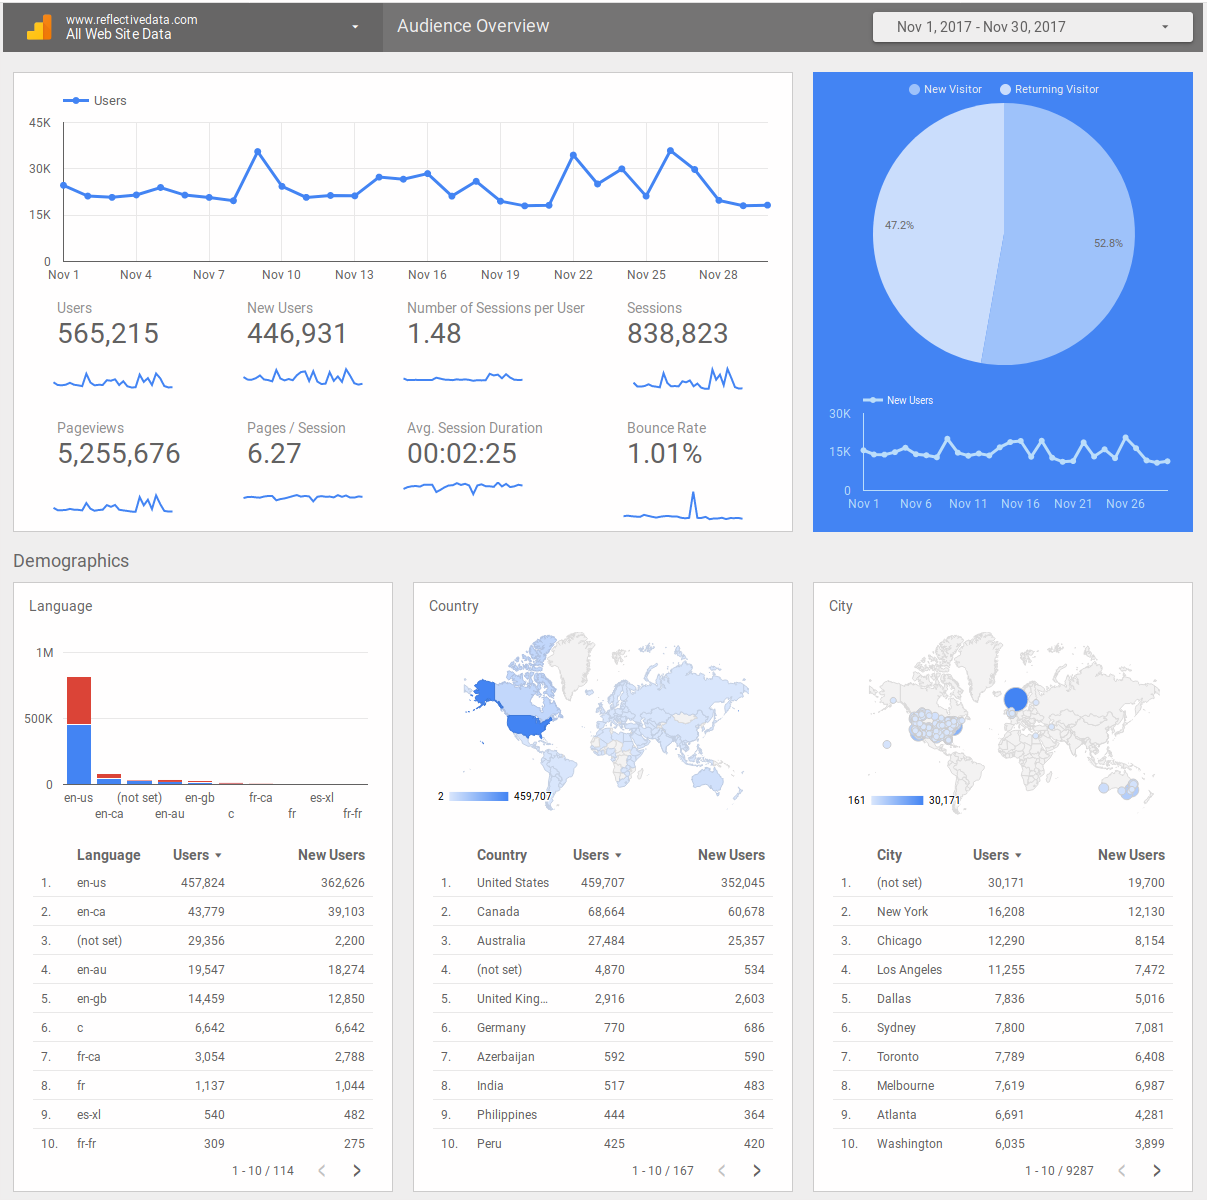
Audience Report
This report gives you a nice overview of who’s visiting your website.
By default, you’ll see users by language, country, city and new vs returning. If this is not enough, you are welcome to add your own dimensions and metrics, the ones that matter the most to you.
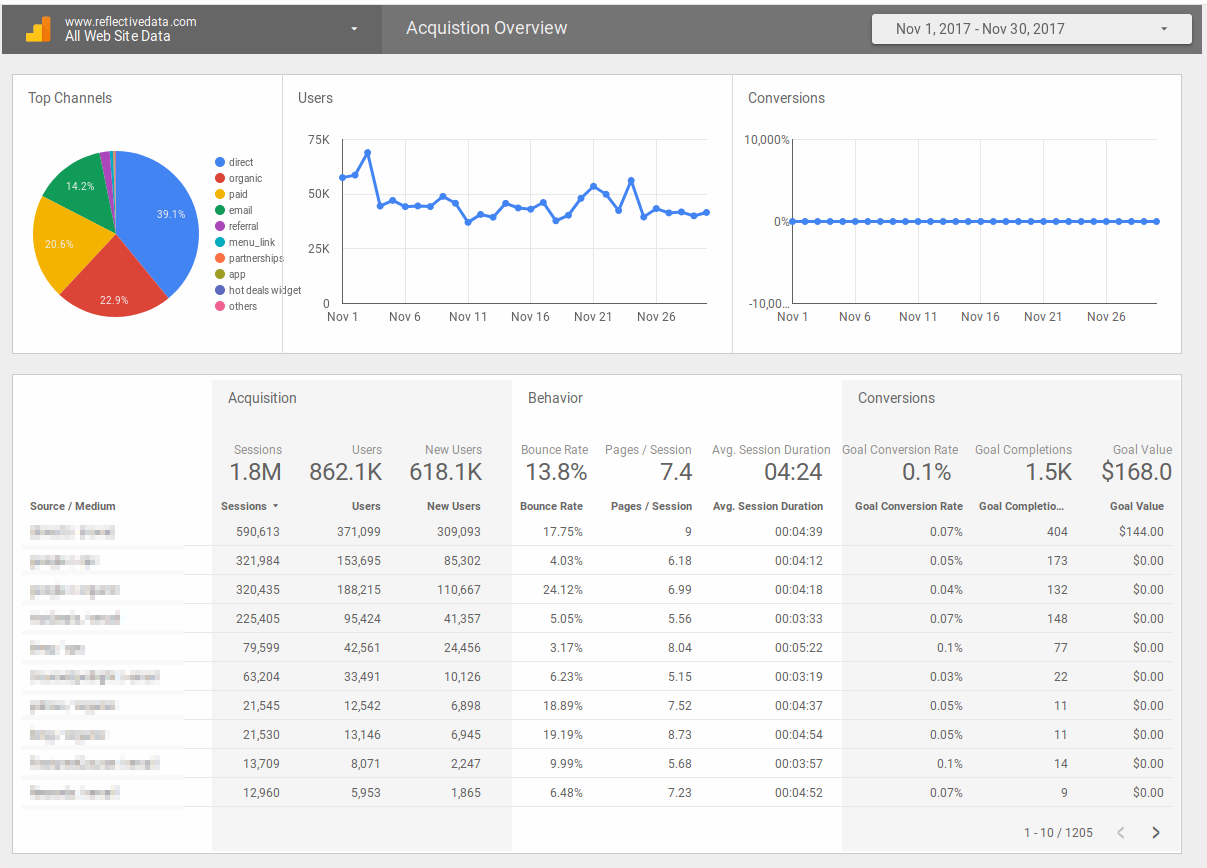
Acquisition Report
This report is meant to show you how you acquire visitors, it is also comparing how each channel compares to others based on session count, bounce rate, conversion rate etc.
Just like with other Data Studio reports, you are free to modify it in any way you want.
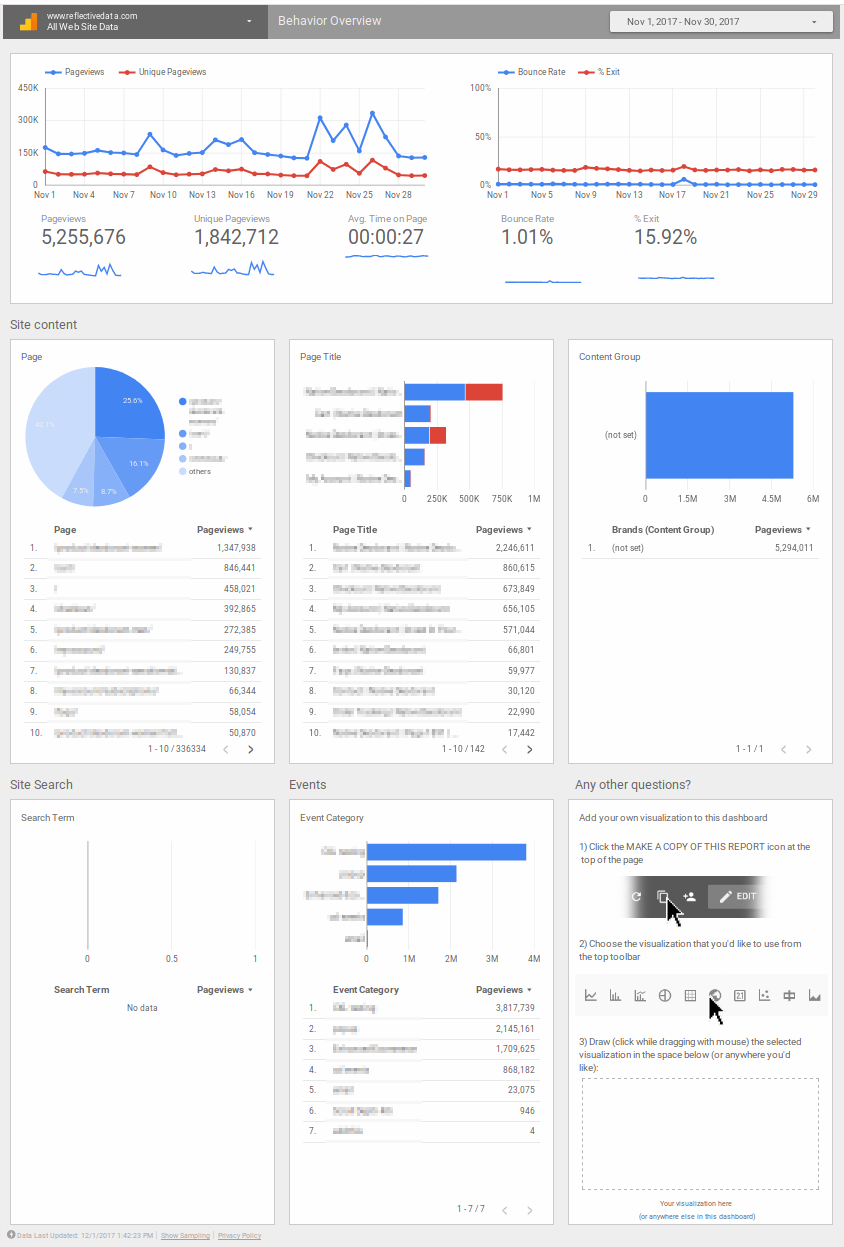
Behaviour Report
Now that you have an overview of who’s visiting your website and how they got there, it’s time to take look at what they are doing while visiting your site.
Behaviour report shows you pageview and bounce rates over time, draws out the top content and even the most popular events and search terms.
Don’t forget that you can make changes to this report to make it meet your needs even better.
Raw Hit-Level Data Report
While connecting Google Data Studio directly to your Google Analytics view is enough for most basic use cases, having access to raw hit-level Google Analytics data opens completely new opportunities for more advanced analysis.
To gain access to raw hit-level Google Analytics, one can use a tool like Marketing Data Pipeline to send data into BigQuery. Google Data Studio has a native connector with BigQuery which makes it easy to explore and visualize based on raw data and metrics calculated based on your own criteria.
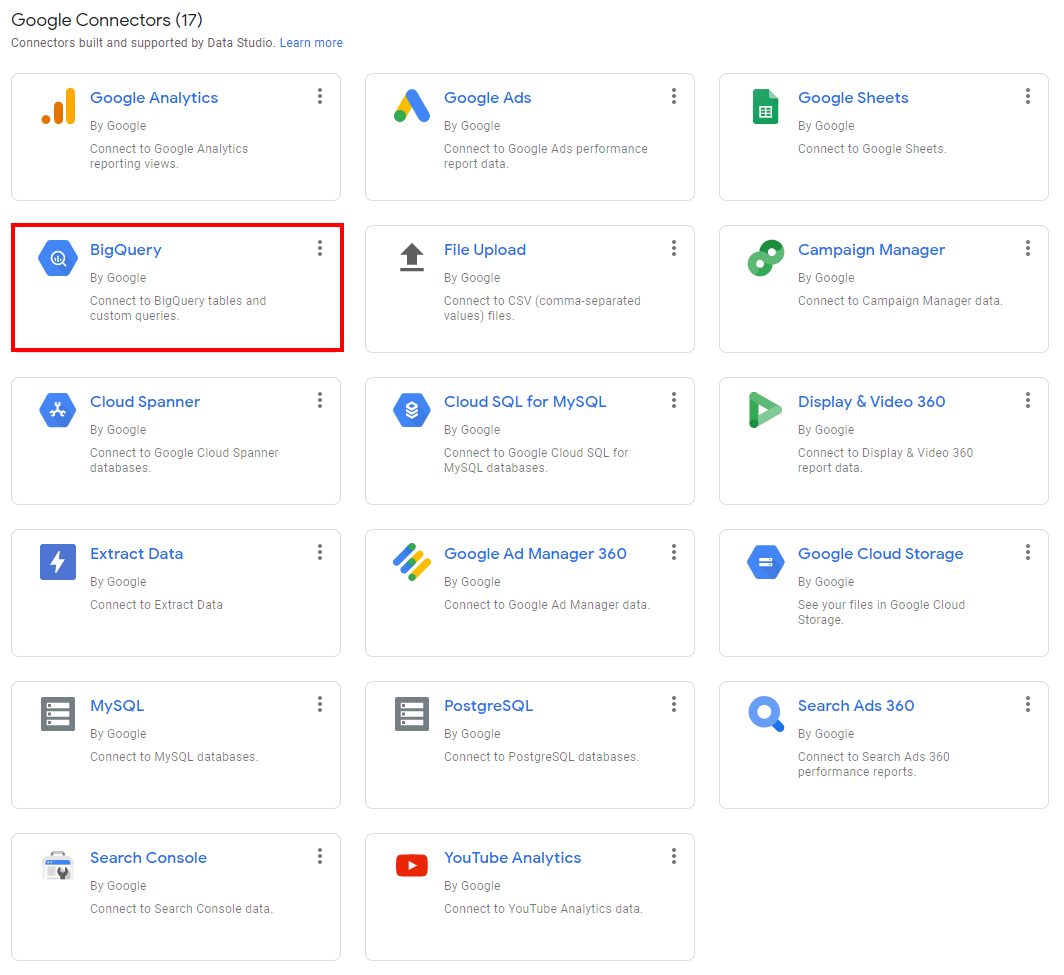
Besides other use cases, having access to raw hit-level data enables you to get a complete overview of the user journey, calculate metrics like LTV and use your own models for marketing channel attribution (Markov, ML-based, FPA etc.).
Learn more about the benefits of having a marketing data warehouse.
Conclusion
Google Data Studio is a powerful tool, it is still in beta and has been developing a lot over the past 6 months. I can’t wait to see the features they are still to add.
I recommend everyone to take a look at Data Studio, add some data sources (such as Google Analytics) and play around a little. I am pretty sure you’ll find it easy to use and very likely even useful for your business.
The three new reports covered in this article make a perfect starting point for everyone interested in Data Studio.
Already using Data Studio? Let us know in the comments which use cases you find the most useful!
How can I merge these reports in a single page or merge them page by page in a single report? Thank you!
Hi Samuel,
You can open them both up in separate browser tabs and just copy-paste the contents over from one to another.
These are wonderful! Thank you so much for sharing them.