There is a wide variety of Javascript data visualization (charting) libraries available for free. One problem this (good) situation has caused is that it can be rather difficult to pick the right one for your project. And, trust me, switching the library after it has grown to be part of your project is a real pain in the butt.
Author: Silver Ringvee
Google Analytics, undoubtedly an industry leader in digital analytics, comes with a decent list of features available out of the box. Naturally, every website is different and so are their key objectives.
Tracking the performance of those key objectives is exactly where Google Analytics goals come into play. In this article, we are covering how to track the popular user actions as goals in Google Analytics.
Google Analytics’s visual interface is great for getting a quick overview and basic data exploration. Often times, in order to find useful insights, you need to take a deeper look and the visual interface just don’t cut it anymore.
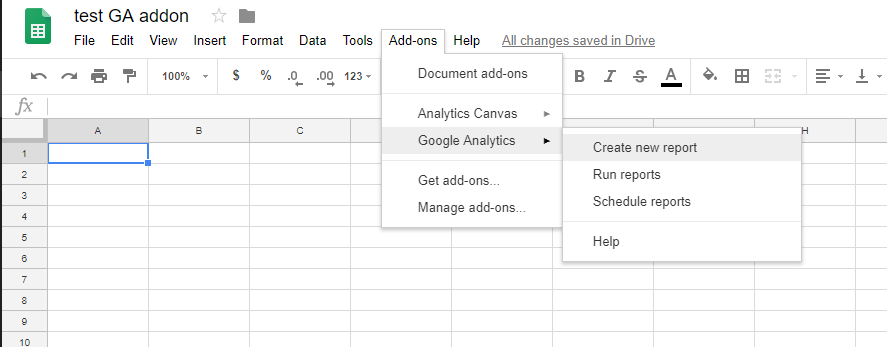
In case you are like me, and many other data-driven marketers/analysts, you like working with spreadsheets. Luckily, pulling your Google Analytics data into Google Spreadsheets is easier than you might think.
If you’ve ever worked with Google Analytics API, you are probably familiar with the Query Explorer. What many users don’t know about is that Google also has a similar tool called Request Composer. The main difference between the two is that while Query Explorer is built on top of Reporting API v3 the Request Composer […]
Apache Superset is a modern, enterprise-ready business intelligence web application that makes it easy to visualise large datasets and build complex dashboards. At Reflective Data, we are using Apache Superset to monitor all data going through our platform with minimum latency. This allows us to easily combine data from different databases and every analyst can […]
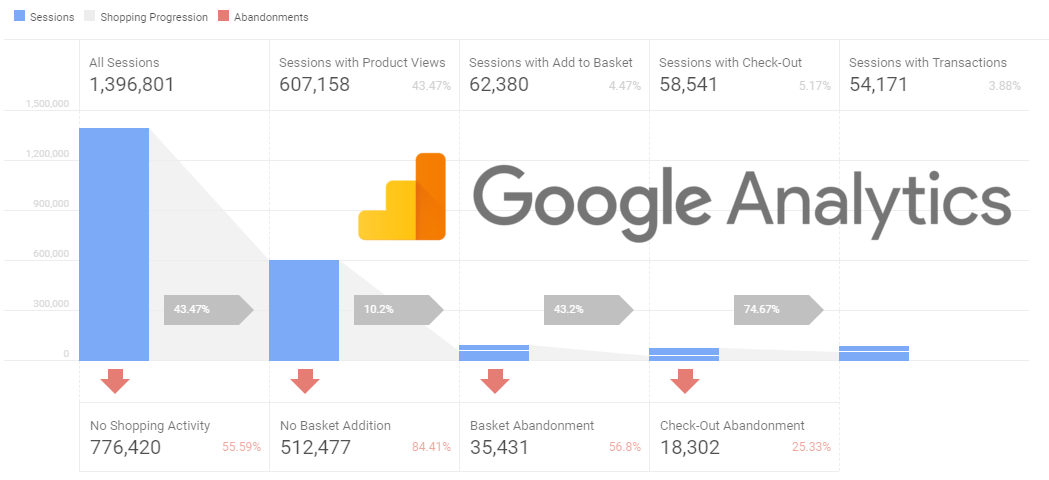
The Enhanced Ecommerce tracking is my favorite feature of Google Analytics, yet so many companies are not using most of its features. It’s time to turn this into your competitive advantage.
While there are other creative use cases, in this article I’m focusing on tracking the websites actually selling goods or services online.
The goal of this article is to provide an up-to-date information and guidelines for implementing Google Analytics Enhanced Ecommerce tracking on an e-commerce site using Google Tag Manager.
This article is for everyone using Google Analytics or Google AdWords on any of their websites and don’t know much about the new gtag.js, yet.
In this article, I am going to give you a quick overview of what gtag.js aka Global Site Tag is as well as who and when should consider migrating from their current tracking setup.
Google Analytics is a very powerful free tool used by millions across the world, Google Analytics 360 (formerly Google Analytics Premium) is it’s paid and even more powerful bigger brother. BigQuery, on the other hand, is a fast, scalable and reasonably priced enterprise-level data warehouse for analytics at any scale.
In this article, I am giving you a few reasons why you should consider upgrading to Google Analytics 360 and an option to seamlessly integrate with BigQuery is a pretty good starting point.
You’ve probably heard of Google Data Studio, a powerful and flexible tool that lets you visualize data from various sources. One of the most popular use cases, in my opinion, has been visualizing data from Google Analytics.
Recently, Google made it even easier to get started with connecting the two, Google Analytics and Data Studio, by giving us three nice-looking yet insightful reports. Even better, you can customize the reports in any way you wish.
Google Analytics limits you to have 20 goals per view. Is it too little or just enough? What actions should be tracked as goals in Google Analytics? These answers will find an answer in this article.


